
BUSS 230 Midterm, Spring 2005
American University of Beirut · Managerial Economics · 6 pages
More BUSS 230 files
- Midterm · Fall 2013ExamView
- Midterm Solution · Fall 2013Exam · with solutionView
- Midterm Review Questions Solution · Fall 2011Exam · with solutionView
- Midterm Review Questions · Fall 2011ExamView
- Midterm · Fall 2006ExamView
- Midterm · Fall 2005ExamView
- Midterm · Spring 2004ExamView
- Midterm · Spring 2004ExamView
Show the text of this exam
OT
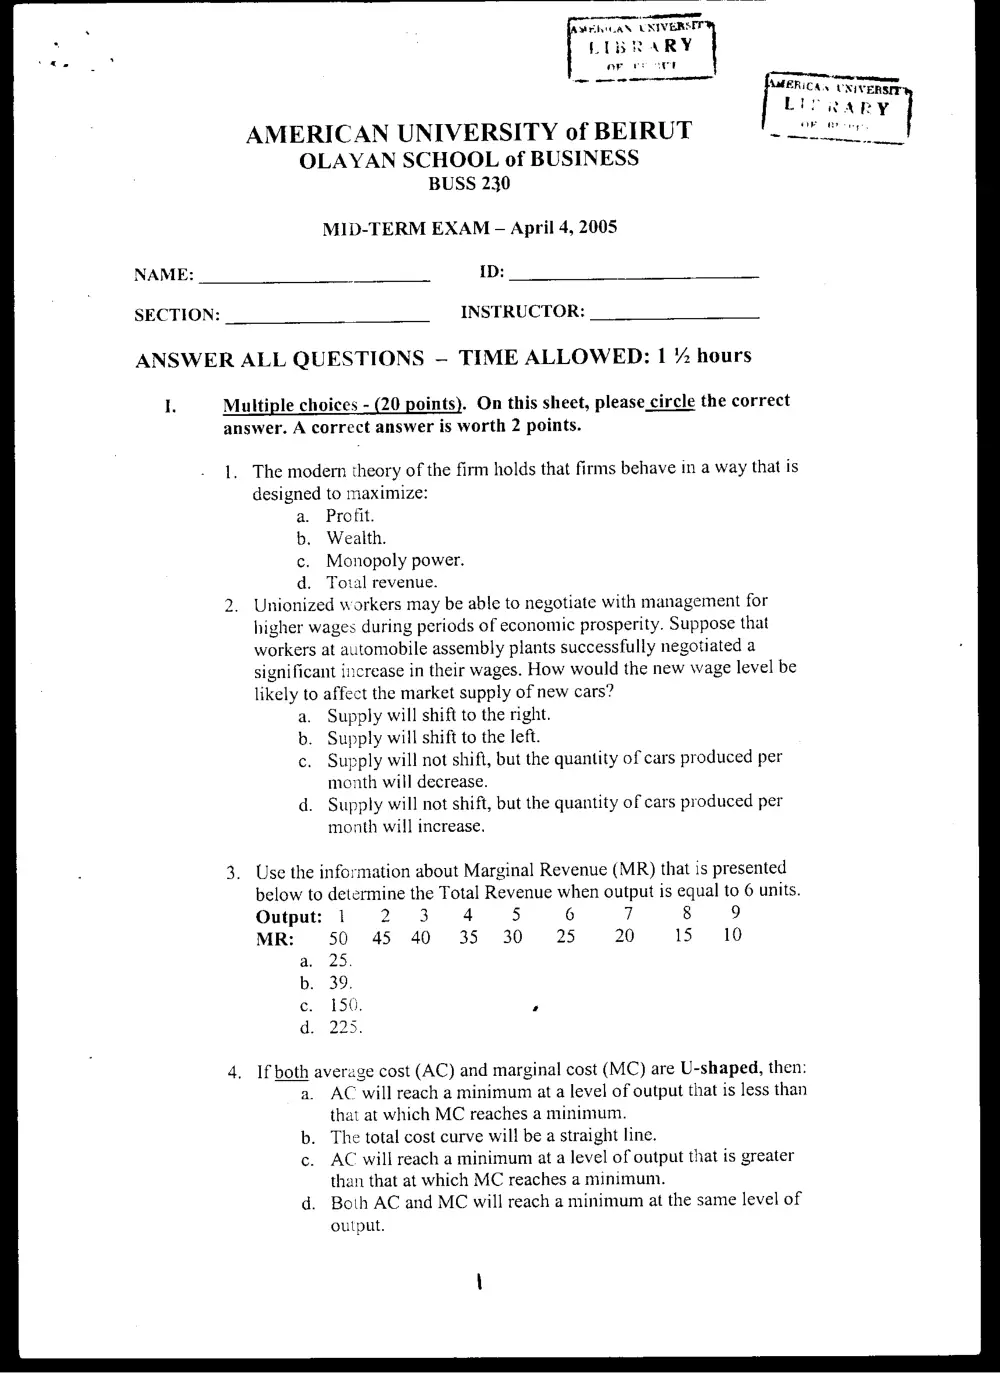
MrhtCAN UNIVERSIT
LIBRARY
ae .
- hs en OL
Ce]
AMERICAN UNIVERSITY of BEIRUT [ a
OLAYAN SCHOOL of BUSINESS
BUSS 230
MID-TERM EXAM - April 4, 2005
NAME: ID:
SECTION: INSTRUCTOR:
ANSWER ALL QUESTIONS — TIME ALLOWED: | % hours
I. Multiple choices - (20 points). On this sheet, please circle the correct
answer. A correct answer is worth 2 points.
1. The modern theory of the firm holds that firms behave in a way that is
designed to maximize:
a. Profit.
b. Wealth.
c. Monopoly power.
d. Total revenue.
2. Unionized workers may be able to negotiate with management for
higher wages during periods of economic prosperity. Suppose that
workers at automobile assembly plants successfully negotiated a
significant increase in their wages. How would the new wage level be
likely to affect the market supply of new cars?
a. Supply will shift to the right.
b. Supply will shift to the left.
c. Supply will not shifi, but the quantity of cars produced per
month will decrease.
d. Supply will not shift, but the quantity of cars produced per
month will increase.
Use the information about Marginal Revenue (MR) that is presented
below to determine the Total Revenue when output is equal to 6 units.
Output: 1 2 3 4 5 6 7 8 9
MR: 50 45 40 35 30 25 20 15 10
a. 25.
b. 39.
c. 150. ’
d. 225.
If both average cost (AC) and marginal cost (MC) are U-shaped, then:
a. AC will reach a minimum at a level of output that is less than
that at which MC reaches a minimum.
b. The total cost curve will be a straight line.
c. AC will reach a minimum at a level of output that is greater
than that at which MC reaches a minimum.
d. Both AC and MC will reach a minimum at the same level of
output.
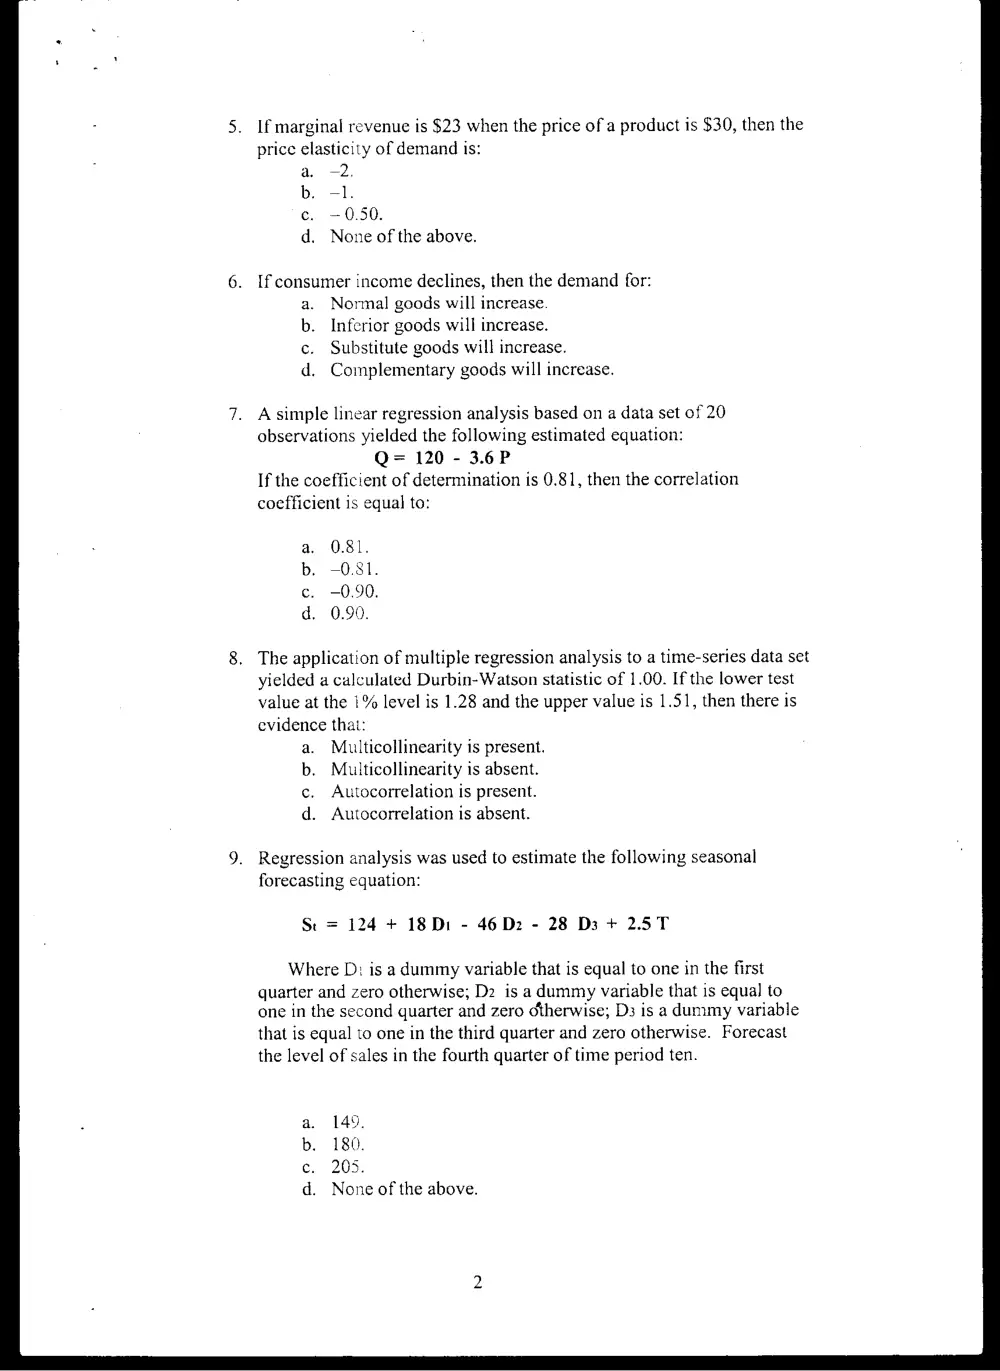
If marginal revenue is $23 when the price of a product is $30, then the
price elasticity of demand is:
a. —2.
b. -1.
ec. —0.50.
d. None of the above.
If consumer income declines, then the demand for:
a. Normal goods will increase.
b. Inferior goods will increase.
c. Substitute goods will increase.
d. Complementary goods will increase.
A simple linear regression analysis based on a data set of 20
observations yielded the following estimated equation:
Q= 120 - 3.6P
If the coefficient of determination is 0.81, then the correlation
coefficient is equal to:
a. 0.81.
b. -0.81.
c. -0.90.
d. 0.90.
The application of multiple regression analysis to a time-series data set
yielded a calculated Durbin-Watson statistic of 1.00. If the lower test
value at the 1% level is 1.28 and the upper value is 1.51, then there is
evidence that:
a. Multicollinearity is present.
b. Multicollinearity is absent.
c. Autocorrelation is present.
d. Autocorrelation is absent.
Regression analysis was used to estimate the following seasonal
forecasting equation:
St = 124 + 18Di - 46 D2 - 28 D3 + 2.5T
Where D: is a dummy variable that is equal to one in the first
quarter and zero otherwise; D2 is a dummy variable that is equal to
one in the second quarter and zero otherwise; D3 is a dummy variable
that is equal to one in the third quarter and zero otherwise. Forecast
the level of sales in the fourth quarter of time period ten.
a. 149,
b. 180.
c. 205.
d. None of the above.
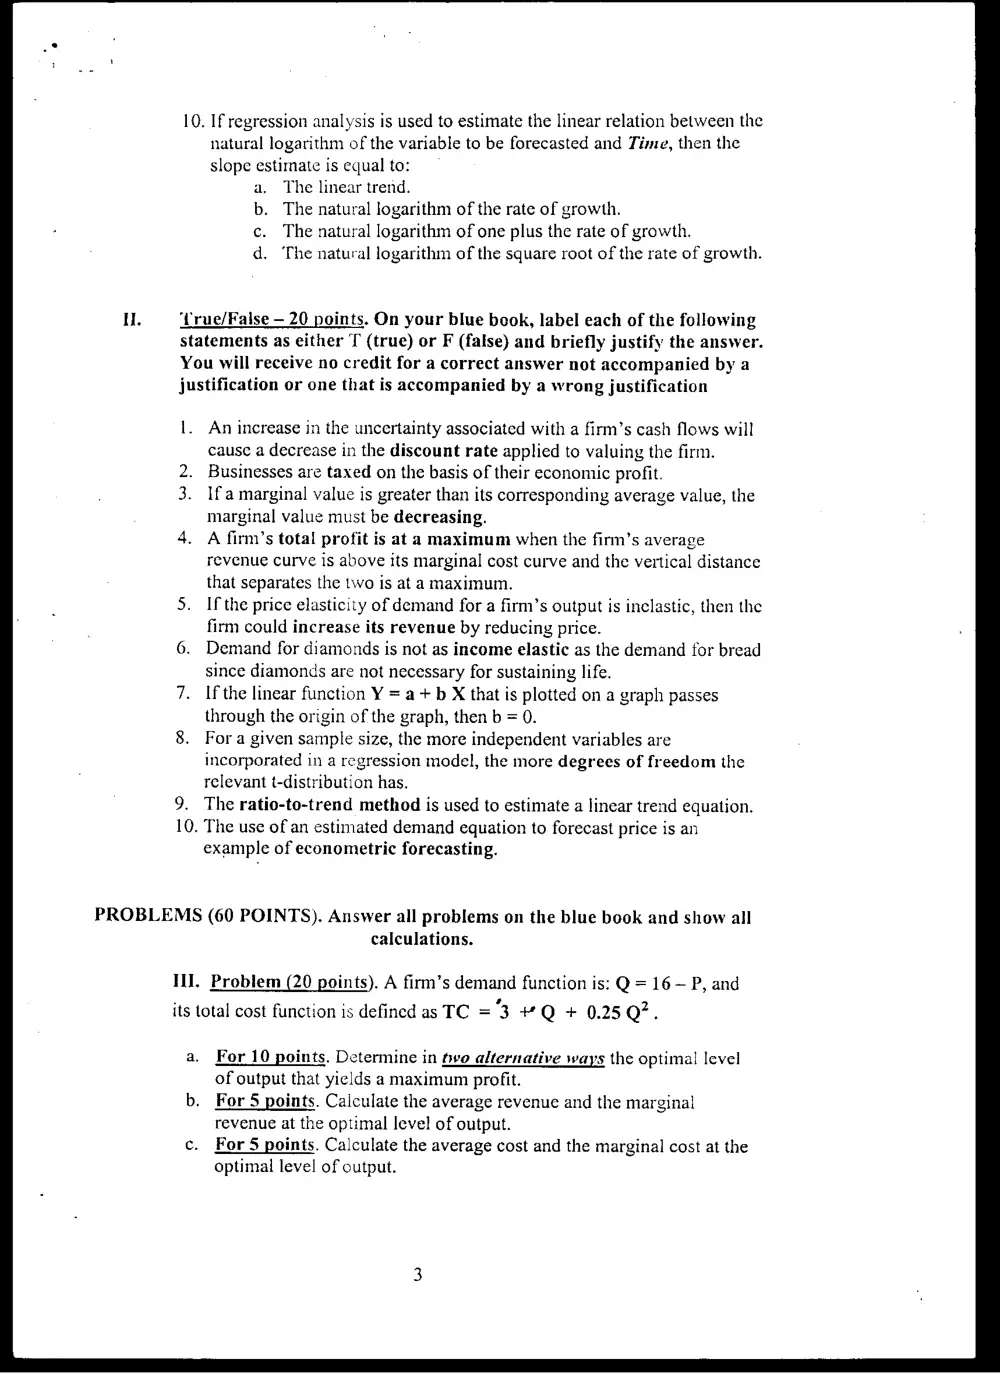
10. If regression analysis is used to estimate the linear relation between the
natural logarithm of the variable to be forecasted and Time, then the
slope estimate is equal to:
a. The linear trend.
b. The natural logarithm of the rate of growth.
c. The natural logarithm of one plus the rate of growth.
d. The natural logarithm of the square root of the rate of growth.
‘Lrue/False — 20 points. On your blue beok, label each of the following
statements as either T (true) or F (false) and briefly justify the answer.
You will receive no credit for a correct answer not accompanied by a
justification or one that is accompanied by a wrong justification
1. An increase in the uncertainty associated with a firm’s cash flows will
cause a decrease in the discount rate applied to valuing the firm.
Businesses are taxed on the basis of their economic profit.
Ifa marginal value is greater than its corresponding average value, the
marginal value must be decreasing.
A firm’s total profit is at a maximum when the firm’s average
revenue curve is above its marginal cost curve and the vertical distance
that separates the two is at a maximum.
If the price elasticity of demand for a firm’s output is inclastic, then the
firm could increase its revenue by reducing price.
Demand for diamonds is not as income elastic as the demand for bread
since diamonds are not necessary for sustaining life.
If the linear function Y = a + b X that is plotted on a graph passes
through the origin of the graph, then b = 0.
For a given sample size, the more independent variables are
incorporated in a regression model, the more degrees of freedom the
relevant t-distribution has.
The ratio-to-trend method is used to estimate a linear trend equation.
. The use of an estimated demand equation to forecast price is an
example of econometric forecasting.
PROBLEMS (60 POINTS). Answer all problems on the blue book and show all
calculations.
III. Problem (20 points). A firm’s demand function is: Q = 16 — P, and
its total cost function is defined as TC = "3 ¥ Q + 0.25 Q?.
a. For 10 points. Determine in hve alternative ways the optimal level
of output that yields a maximum profit.
b. For 5 points. Calculate the average revenue and the marginal
revenue at the optimal level of output.
For 5 points. Calculate the average cost and the marginal cost at the
optimal level of output.
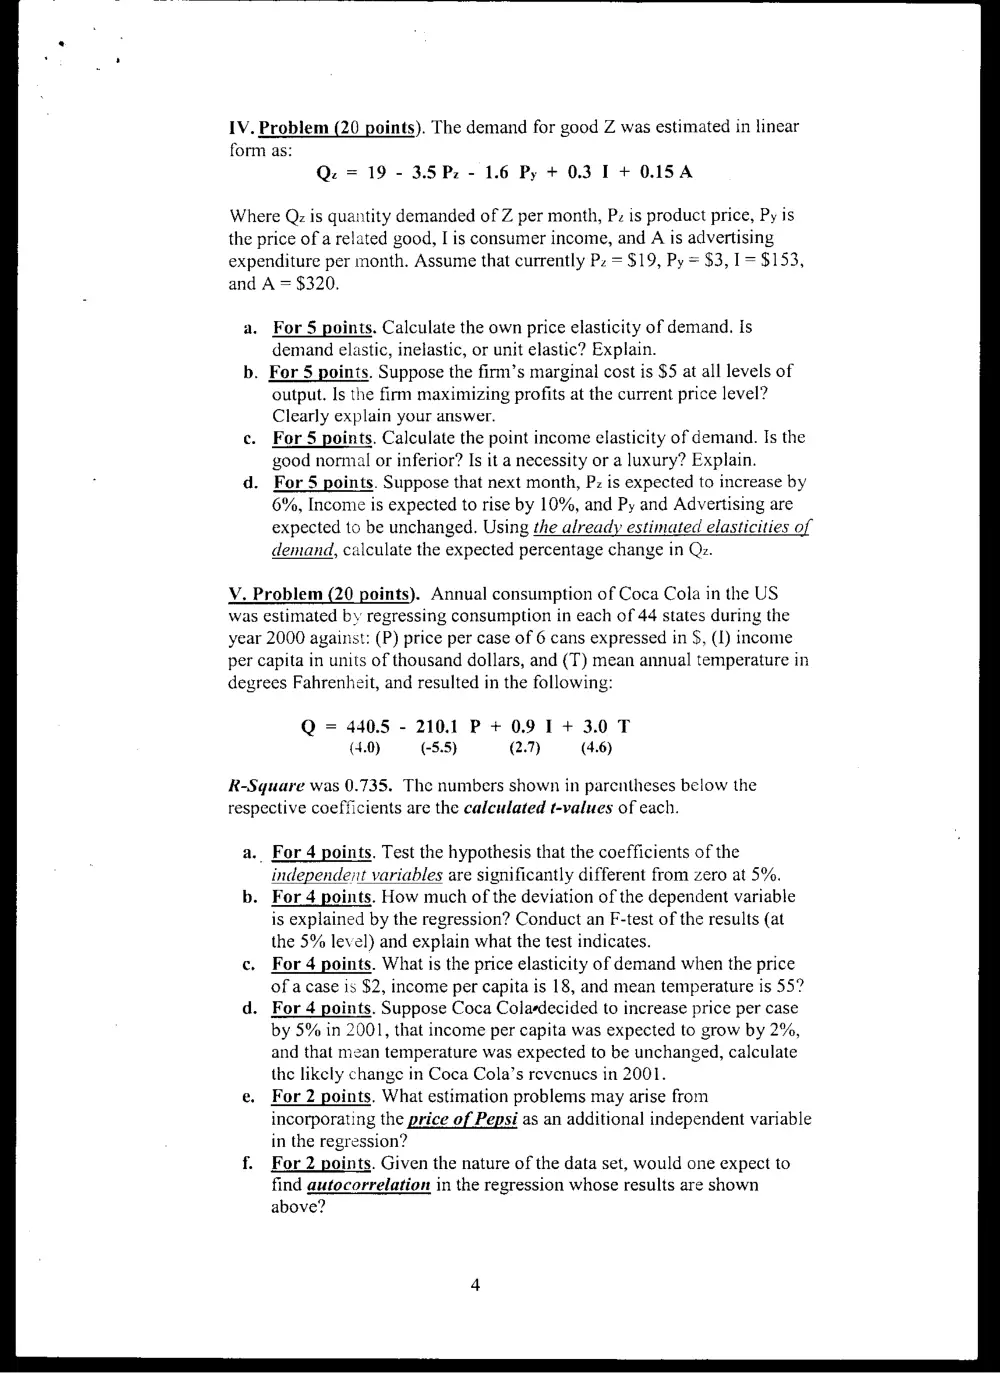
IV. Problem (20 points). The demand for good Z was estimated in linear
form as:
Q. = 19 - 3.5 Pz - 1.6 Py + 0.3 1+ O.1SA
Where Qz is quantity demanded of Z per month, Pz is product price, Py is
the price of a related good, I is consumer income, and A is advertising
expenditure per month. Assume that currently Pz = $19, Py = $3, 1= $153,
and A = $320.
a. For 5 points. Calculate the own price elasticity of demand. Is
demand elastic, inelastic, or unit elastic? Explain.
b. For 5 points. Suppose the firm’s marginal cost is $5 at all levels of
output. Is the firm maximizing profits at the current price level?
Clearly explain your answer.
For 5 points. Calculate the point income elasticity of demand. Is the
good normal or inferior? Is it a necessity or a luxury? Explain.
. For 5 points. Suppose that next month, Pz is expected to increase by
6%, Income is expected to rise by 10%, and Py and Advertising are
expected to be unchanged. Using the already estimated elasticities of
demand, calculate the expected percentage change in Qz.
V. Problem (20 points). Annual consumption of Coca Cola in the US
was estimated by regressing consumption in each of 44 states during the
year 2000 against: (P) price per case of 6 cans expressed in $, (1) income
per capita in units of thousand dollars, and (T) mean annual temperature in
degrees Fahrenheit, and resulted in the following:
Q = 440.5 - 210.1 P + 0.9 I+ 3.0 T
(4.0) (-5.5) (2.7) (4.6)
R-Square was 0.735. The numbers shown in parentheses below the
respective coefficients are the calculated t-values of each.
.. For 4 points. Test the hypothesis that the coefficients of the
independent variables are significantly different from zero at 5%.
. For 4 points. How much of the deviation of the dependent variable
is explained by the regression? Conduct an F-test of the results (at
the 5% level) and explain what the test indicates.
For 4 points. What is the price elasticity of demand when the price
of a case is $2, income per capita is 18, and mean temperature is 55?
. For 4 points. Suppose Coca Colaedecided to increase price per case
by 5% in 2001, that income per capita was expected to grow by 2%,
and that mean temperature was expected to be unchanged, calculate
the likely change in Coca Cola’s revenues in 2001.
For 2 points. What estimation problems may arise from
incorporating the price of Pepsi as an additional independent variable
in the regression?
For 2 points. Given the nature of the data set, would one expect to
find autocorrelation in the regression whose results are shown
above?
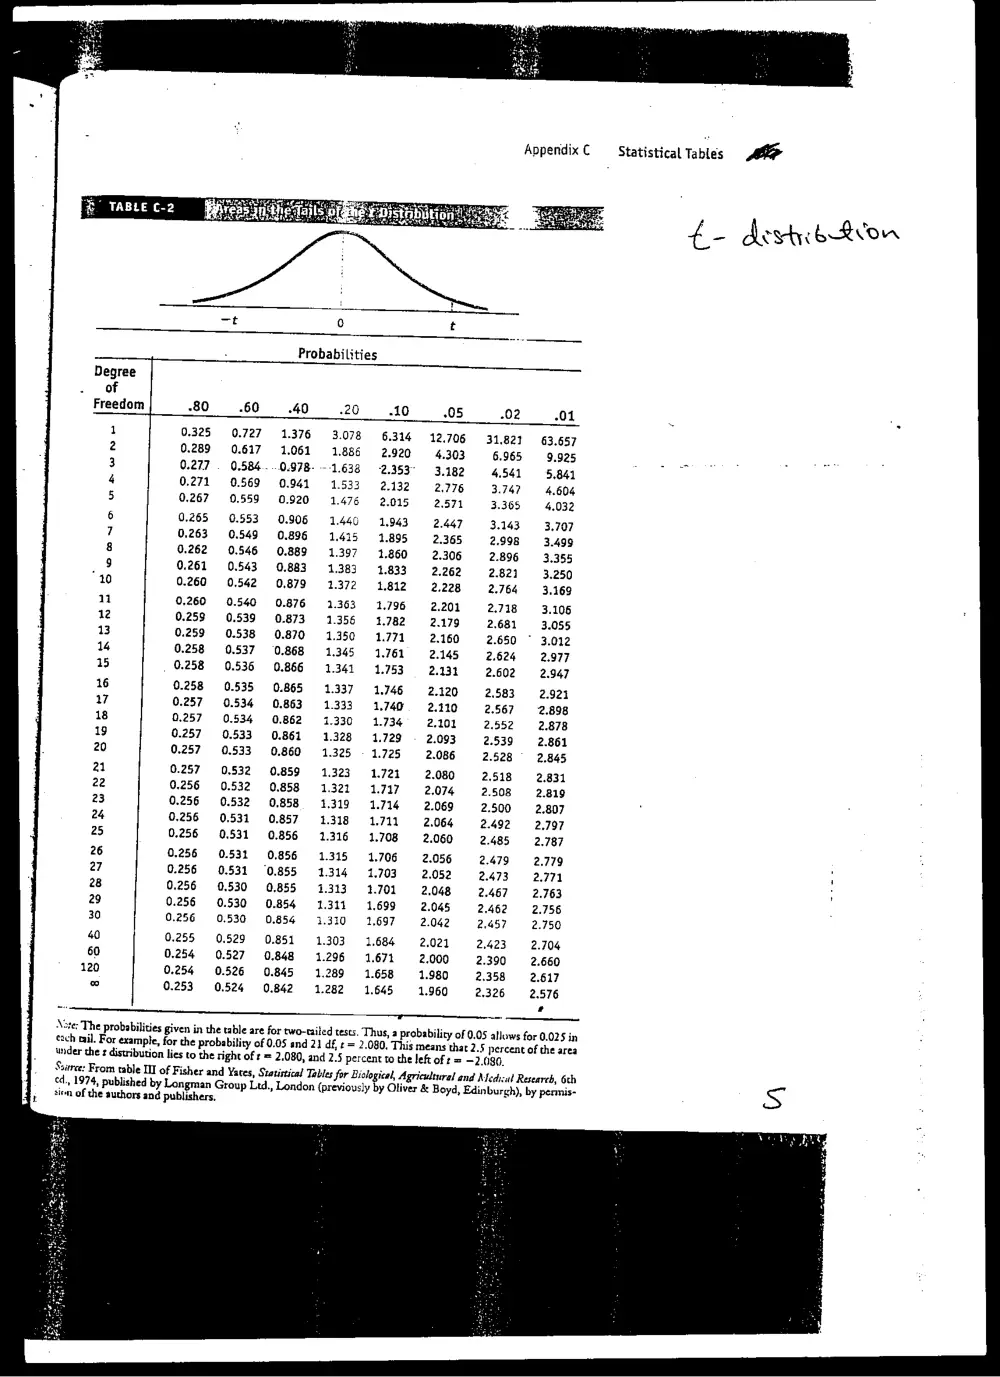
Appendix C
B TABLE C-2
o)
Probabilities
-80 -60 -40 : -10 205 -02 01
0.325 0.727 = 1.376 A 6.314 12.706 31.821 63.657
0.289 0.617 1,061 . 2.920 4.303 6.965 9.925
0.277 . 0.584. .0.978- --1. 2.353" 3.182 4.541 5.841
0.271 0.569 0.941 . 2.132 2.776 3.747 4.604
0.267 0.559 0,920 . 2.015 2.571 3.365 4.032
0.265 0.553 0.906 440 1,943 2.447 3.143 3.707
0.263 0.549 0.896 . 1.895 2.365 2.998 3.499
0.262 0.546 0.889 . 1.860 2.306 2.896 3.355
0.261 0,543 0,883 e 1.833 2.262 2.821 3.250
0.260 0.542 0,879 . 1.812 2.228 2.764 3.169
0.260 0.540 0.876 . 1.796 2.201 2.718 3.106
0.259 0.539 (0.873 : 1.782 2.179 2.681 3.055
0.259 0.538 0.870 . 1.771 2.160 2.650 * 3.012
0.258 0.537 0.868 “ 1.761 2.145 2.624 2.977
0.258 0.536 0.866 - 1.753 2.131 2.602 2.947
0.258 0.535 0.865 . 1.746 2.120 2.583 2.921
0.257 0.534 «0.863 - 1.740. 2.110 2.567 2.898
0.257 0.534 0,862 - 1.734 2.102 2.552 2.878
0.257 0.533 (0.861 . 1.729 2.093 2.539 2.861
0.257 0,533 0.860 . 1.725 2.086 2.528 2.845
0.257 0.532 0.859 . 1.721 2.080 2.518 2.831
0.256 0.532 0.858 . 1.717 2.074 2,508 2.819
0.256 0.532 0,858 . 1.714 2.069 2.500 2.807
0.256 0,531 0.857 . 1711 2.064 2.492 2,797
0.256 0.531 0.856 . 1.708 2.060 2.485 2.787
0.256 0.531 0.856 - 1.706 2.056 2.479 2.779
0.256 0.531 0,855 . 1.703 2,052 2.473 2.771
0.256 0.530 0.855 . 1.701 2,048 2.467 2.763
0.256 0.530 0.854 . 1.699 2.045 2.462 2.756
0,256 0.530 0.854 “ 1,697 2.042 2,457 2.750
0.255 0.529 0.851 . 1,684 2,021 2.423 2.704
0.254 0.527 0.848 - 1.671 2.000 2.390 2.660
0.254 0.526 0.845 . 1.658 1.980 2.358 2.617
0.253 0.524 0.842 . 1.645 1.960 2,326 2.576
r)
+ ~—
Aste: The probabilities given in the table are for two-tailed tests. Thus, a probability of 0.05 allows for 0.025 in
each mil. For example, for the probability of 0.05 and 21 df, t = 2.080. This means that 2.5 percent of the area
wnder the ¢ distribution lies to the right of = 2,080, and 2.5 percent to the left of t = -2.080.
Scarce: From table UI of Fi isher and Yates, Statistical Tables for Biological, Agricultural and Medical Research, 6th
ed., 1974, published by Longman Group Ltd., London {previously by Oliver & Boyd, Edinburgh), by permis-
sion of the authors and publishers,
Statistical Tables
t-
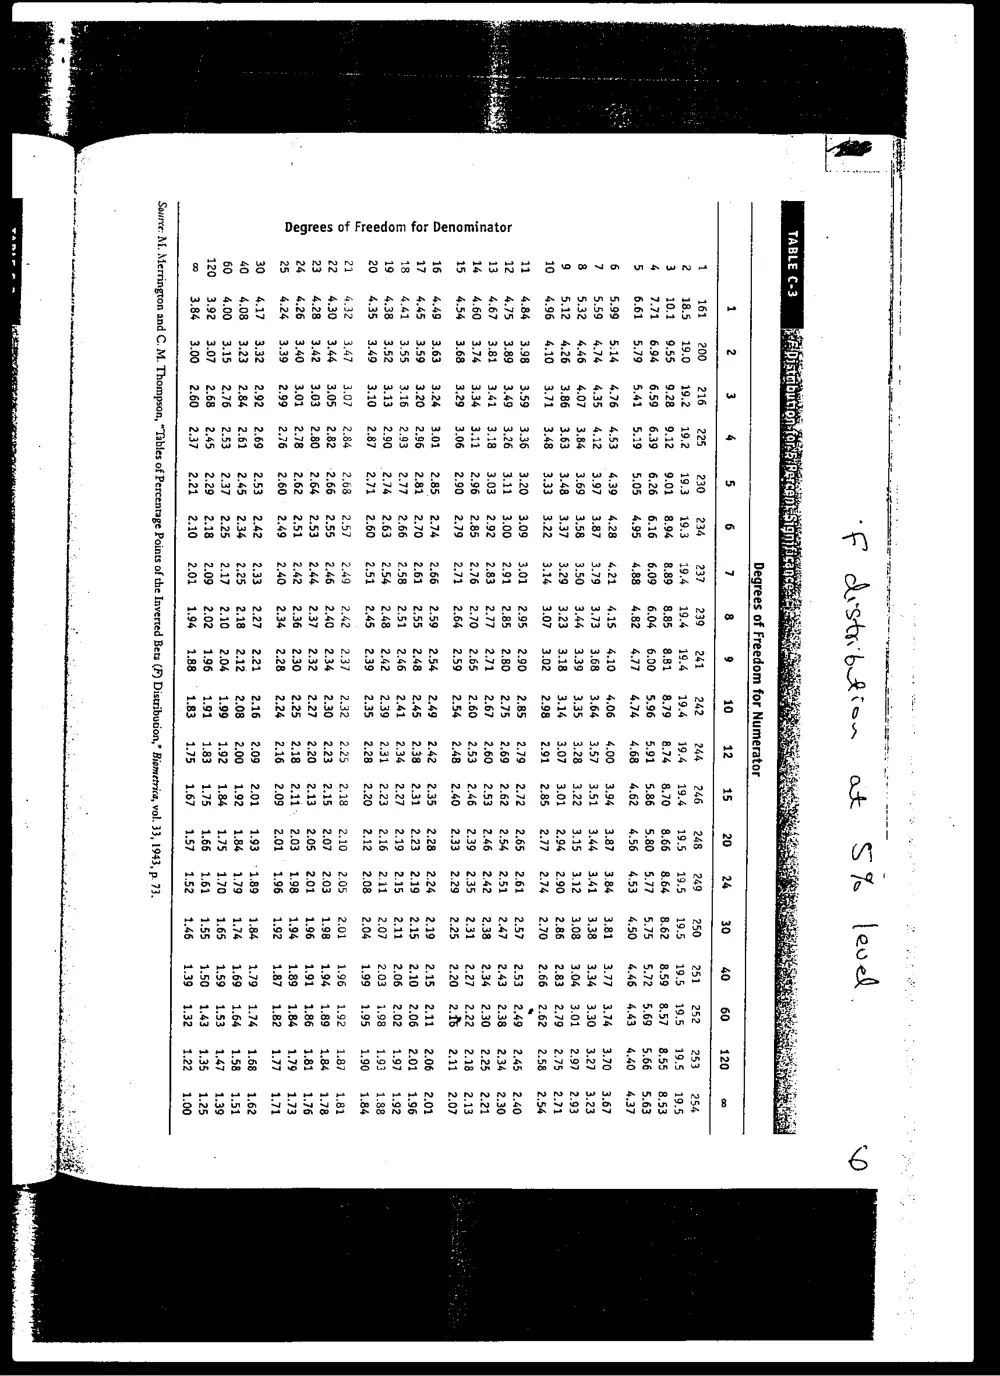
TABLE C-3
Degrees of Freedom for Numerator
1 2 3 4 5 6 7 8 9 10 12 15 20 24 30
161 200 216 225 230 0-234 237 239 244 242 244 246 248 = 249
18.5 19.0 19.2 19.2 19.3 19.3 194 19.4 19.4 19.4 19.4 194 19.5 19.5
10.1 9,55 9.28 9.12 9.01 8.94 889 8.85 881 8.79 8.74 8.70 8.66 8.64
7.71 6.94 6.59 639 626 6.16 6.09 6.04 6.00 5.96 591 586 5.80 5.77
6.61 5.79 5.41 5.19 5.05 4.95 488 482 477 4.74 468 462 456 4.53
5.99 5:14 4.76 453 439 4.28 421 4.15 410 4,06 4.00 3.94 3.87 3.84
5.59 474 4.35 412 3.97 3.87 3.79 3.73 3.68 3.64 3.57 3.51 3.44 3.41
5.32 446 4.07 3.84 3.69 3.58 3.50 3.44 3.39 3.35 3.28 3.22 3.15 3.12
5.12 4.26 3.86 3.63 3.48 3,37 3.29 3.23 3.18 «03.14 3.07 3.01 2.94 = 2.90
4.96 4,10 3.71 3.48 3.33 3.22 3.144 3.07 3.02 2.98 2.91 2.85 2.77 2.74
4.84 3.98 3.59 3.36 3.20 3.09 3.01 2.95 290 2.85 2.79 2.72 2.65 2.61
4.75 3.89 3.49 3.26 3.11 3.00 2.91 2.85 280 2.75 2.69 2.62 2.54 2.51
4.67 3.81 3.41 3.18 3.03 2.92 2.83 2.77 2.71 2.67 2.60 2.53 2.46 2.42
4.60 3.74 3.34 3.11 2.96 2.85 2.76 2.70 2.65 2.60 2.53 246 2.39 2.35
4.54 3.68 3.29 3.06 2.90 2.79 2.71 2.64 2.59 2.54 2.48 2.40 2.33 2.29
449 3.639 3.24 3.01 2.85 2.74 2.66 2.59 254 2.49 2.42 2.35 2.28 2.24
445 3.59 3.20 2.96 2.81 2.70 2.61 2.55 248 2.45 2.38 2.31 2.23 2.19
4.41 3.55 3.16 2.93 2.77 2.66 2.58 2.51 246 2.41 2.34 2.27 2.19 2.15
4.38 3.52 3.13 2.90 2.76 2.63 2.54 2.48 242 2.39 2.31 2.23 2.16 2141
4.35 3.49 3.10 2.87 2.71 2.60 2.51 245 2.39 2.35 2.28 2.20 2.12 2.08
4.32 3.47 3.07 2.84 2.68 2.57 249° 2.42 2.37 2.32 2.25 2.18 2.10 2.05
4.30 3.44 3.05 2.82 2.66 2.55 2.46 2.40 2.34 2.30 2.23 2.15 2.07 2.03
4.28 3.42 3.03 2.80 2.64 2.53 244 2.37 232 2.27. 2.20 2.13 2.05 2.01
4.26 3.40 3.01 2.78 2.62 2.51 2.42 2.36 230 2.25 2.18 211. 2.03 1.98
4.24 3.39 2.99 2.76 260° 2.49 2.40 2.36 2.28 2.24 2.16 2.09 2.01 1.96
4.17 3.32 2.92 2.69 2.53 2.42 2.33 2.27 2.21 2.16 2.09 2.01 1.93 -1.89
4.08 3.23 286 2.61 245 2.346 2.25 218 212 208 2.00 1.92 184 1,79
4.00 3.15 2.76 2.53 2.37 2.25 2.17) 2.10 204 199 1.92 184 1.75 1,70
3,92 3.07 2.68 2.45 2.29 2.18 2.09 202 196 191 183 175 166 1.61
3.84 3.00 260 2.37 221 210 2.01 196 188 183 1.75 1.67 1.57 1.52
5
5
=
£
E
5
i=}
v
a
_
&
E
i=}
a=]
3
3
2
=
ha
5
a
8
3
a
$
a
Source: M. Merrington and C. M. Thompson, “Tables of Percentage Points of the Inverted Beta (F) Distribution,” Biometrica, vol. 33, 1943, p. 73.