
BUSS 230 Midterm, Fall 2005
American University of Beirut · Managerial Economics · 8 pages

More BUSS 230 files
- Midterm Solution · Fall 2013Exam · with solutionView
- Midterm · Fall 2013ExamView
- Midterm Review Questions Solution · Fall 2011Exam · with solutionView
- Midterm Review Questions · Fall 2011ExamView
- Midterm · Fall 2006ExamView
- Midterm · Spring 2005ExamView
- Midterm · Spring 2004ExamView
- Midterm · Spring 2004ExamView
Show the text of this exam
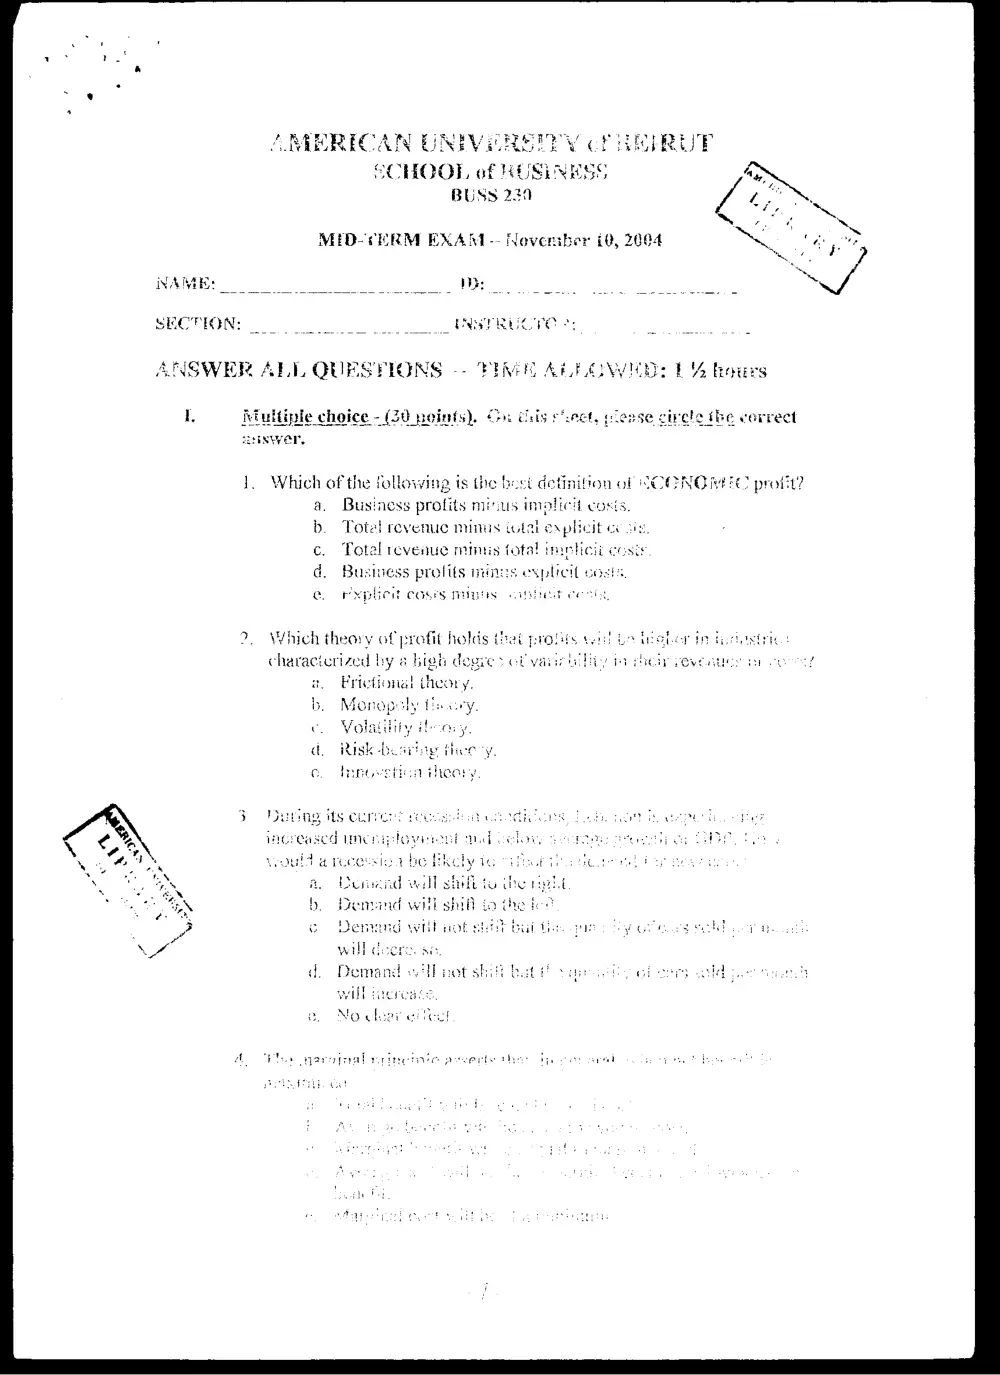
AMERECAN UNIViIREIETY CP ihi RUE
SCHOO tUSERESS
NAME: WB:
SECTION:
VSWER ALL QUESFIONS -- FEMA ALBGWI)
tiple choi
r,
Which of the following is the | ictinition of MCONOKREEC profit?
ness profits Minus imal
Totel revenuc minus iotat explici
Total revenue mmuis total ip
38 prolits id i
cit cass minus
Which theary of profit holds
characicrized by a bigh degre =
Frictional
Mone
Voi
Risk
Tipo:
3 its eur
reased umes
could @ rece:
Roruaad wi
Demand wit shill
Demand wit not
7. The price ofa firm's}
ia firm’s marginal revenue is greater than its mar ginal cost, then the
firm should:
a. Increase cutput to increase profit.
b. Decrease output to increase profit.
c. Keep output unchanged.
d. Collect additional information before deciding what to do.
Ifa firm is producing a level of output where marginal cost is equal to
marginal revenue, then:
a Profit is at a maxinmm if marginal cost has a negative s!
and marginal revenue is horizontal.
b. Profit is at a minimum if marginal cost has a nogative slope
and marginal revenue is horizontal.
c. Profit is at a maximum if average revenue is greater than
average cost.
d. Profit is at a minimum if average revenue is greater than
average cost
c. Profit is at a minimum if marginal cost has a positive slope
and marginal revenue is horizontal.
sroduct declines fram S14 to SO Asa result, the
y domenuded oF i rodiict iver sos
Mt
The ave price clasticity of dermand for thie gocd is equal to:
a. -100
b. -i0
ce,
d. -O1
a - O01,
firm’s product is $3.0 aii ths
iv the price clasticity of demand for
ineonie elasticity of demand for (he product is 2.5, the firny’» total
ranped ia LG Gecieess:
revenue fi
Ssanie
ried by s:
Ome is aeconly
4 Increase in product price
b. 0.5% decrease in product price.
2 1% Inciease in predict price. \
2% decrease in product price. ;
increase in product price.
a OSS
9. ‘the price ciasticity of demand for a good will
; hroadly defined (eg
sod is
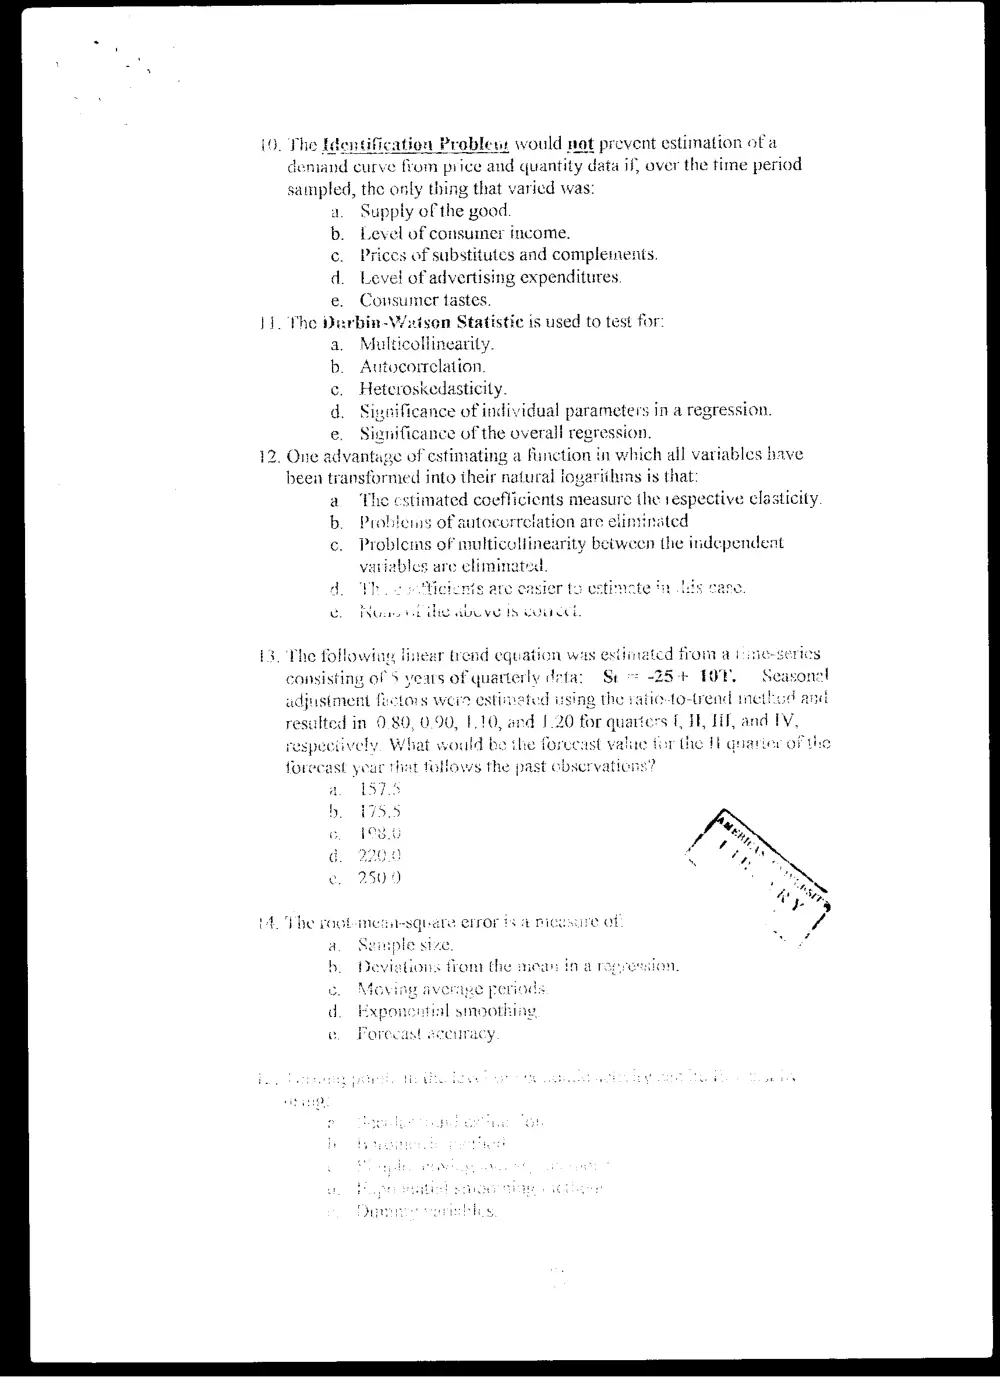
iO. The Identification Probles: would net prevent estimation ofa
demand curve from price and quantity data if, over the time period
sampled, the only thing that varied was:
Supply of the good.
vel of consumer income.
s of substitutes and complements.
Level of advertising expenditures
Consumer tastes.
Ji. The ps arbin- Watson Statistic is used to test for:
a. Multicollinearily.
Autocorrelation.
Hetcroskedasticity.
ignificance of individual parameters i1 in a regression.
iificance of the overall regression.
12. One advantage of estimating a function in which all variables bave
been transformed into their natural iogariihims is that:
a. The cstimated coefficients measure the 1espective clasticity.
Problons of autocorrelation are elintinated
Problems of multicullinearity between the independent
variables are eliminated.
Yh oetents are casier to
ds nay :
Nous ta ihe above ts cuucel,
13. The followine linear trend equation was estinatcd trom atu
consisting of S years of quarterly defa: Sto -25-+ TOP,
adjustment fictors were estineted using the ratio-to-trend meth
resulted in 0.80, 0.90, 1.10, and J 20 for quarters 1, JE, HT, and Ty,
respectively. What would be ihe forecast value for the HE qnarier af the
forec ast year that follows the past observations?
a. S75
). E7S.5
G18
Gg 2208
e. 2509
14. Phe rool-inesintesquate error
a, Semple size.
b. Devigtions from the mean in a res
Moving average periods
exponential smoothing,
t
ie
rn
V
Orecdst Gccuracy
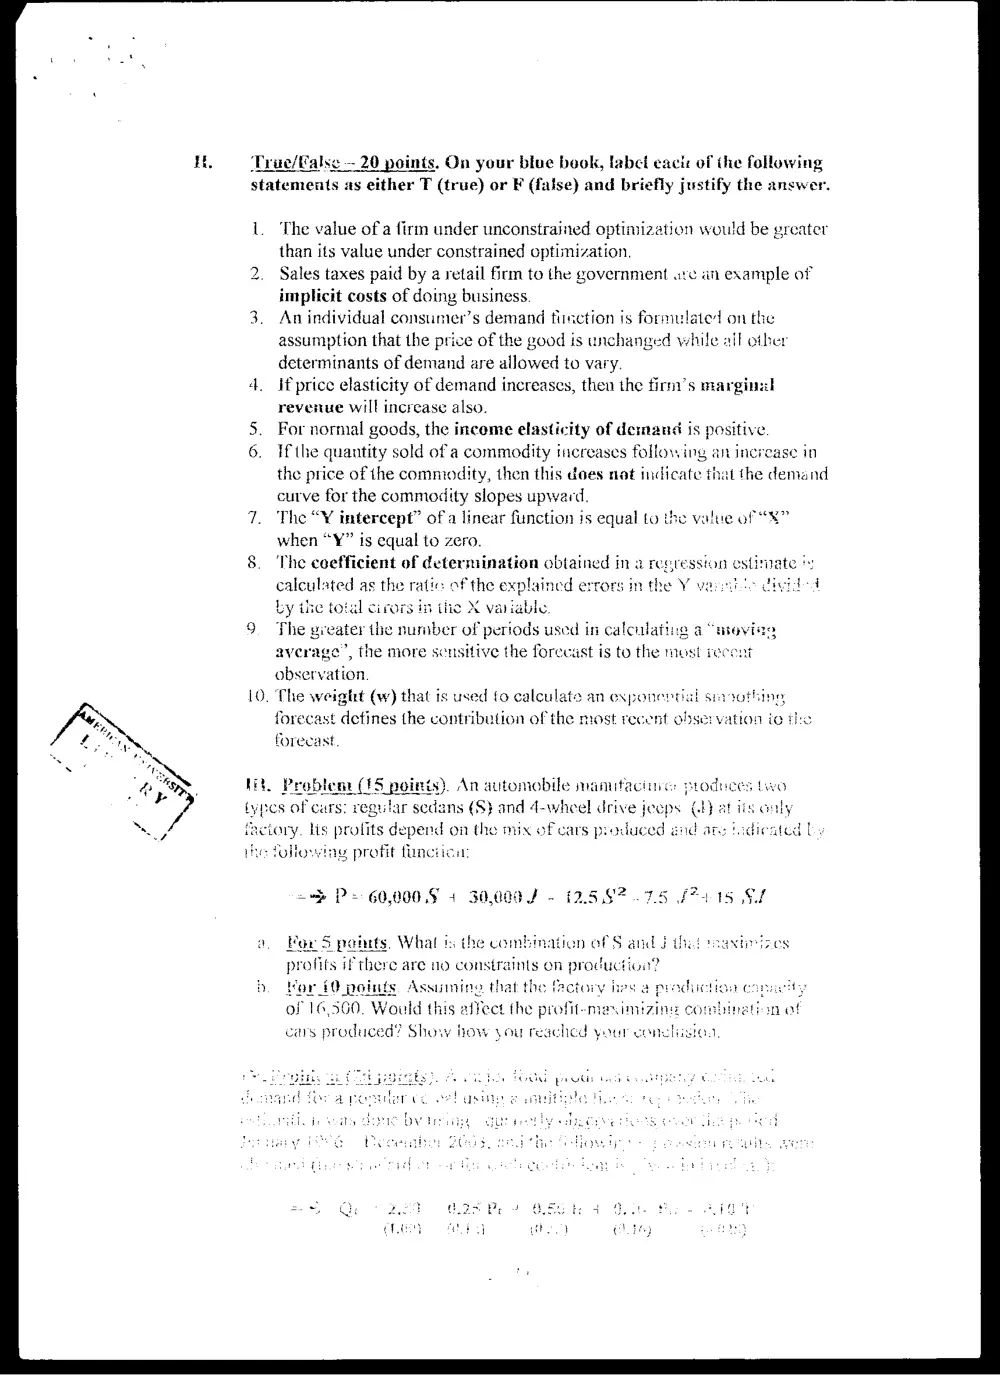
Trae/Kalse -- 20 points. On your blue book, label eaci: of the following
statements as either T (true) or F (false) and briefly justify the answer.
The value of a firm under unconstrained optimization would be greater
than its value under constrained optimization.
Sales taxes paid by a retail firm to the government are an example of
implicit costs of doing business.
An individual consumer’s demand fiction 1s formulated on the
assumption that the price of the good is unchanged while all other
determinants of demand are allowed to vary.
if price elasticity of demand increases, then the firm’s margins
revenue will increase also.
For normal goods, the income elasticity of demand is positive.
If the quantity sold of a commodity increases following an increase in
the price of the commodity, then this does mot indicate that the demand
curve for the commodity slopes upward.
The “Y intercept” of a linear function is equal to the value of “X”
when “Y” is equal to zero.
The coefficient of determination obtained in a regression estimate '
calculated as the ratic of the explained errors in the Y yarn .
by ihe total cirors in tic X variable.
The greater the number of periods used in calculating a “meviee
average’, the more scusitive the forecast is to the most recent
observation.
. The weight (yw) that is used fo calculate an exponertial smoothing
forecast defines the contribution of the most recent ob ation io the
forecast.
th. Problem: (15 points). An automobile manutacinie: produces
tory. lis profits depend on the mix of cars produced end are tidicated by
& profit tuncti
2
a} P= 60,0005 4 3a000/ - 12.587 .75 #7115 SF
S pontts. Whal is the combmation of S and J the!
profits if there are no constraints on produc
d R pies a pradiictton con
of 16,560. Would this affect the profit-maximizing
Abe POG
gsine ean
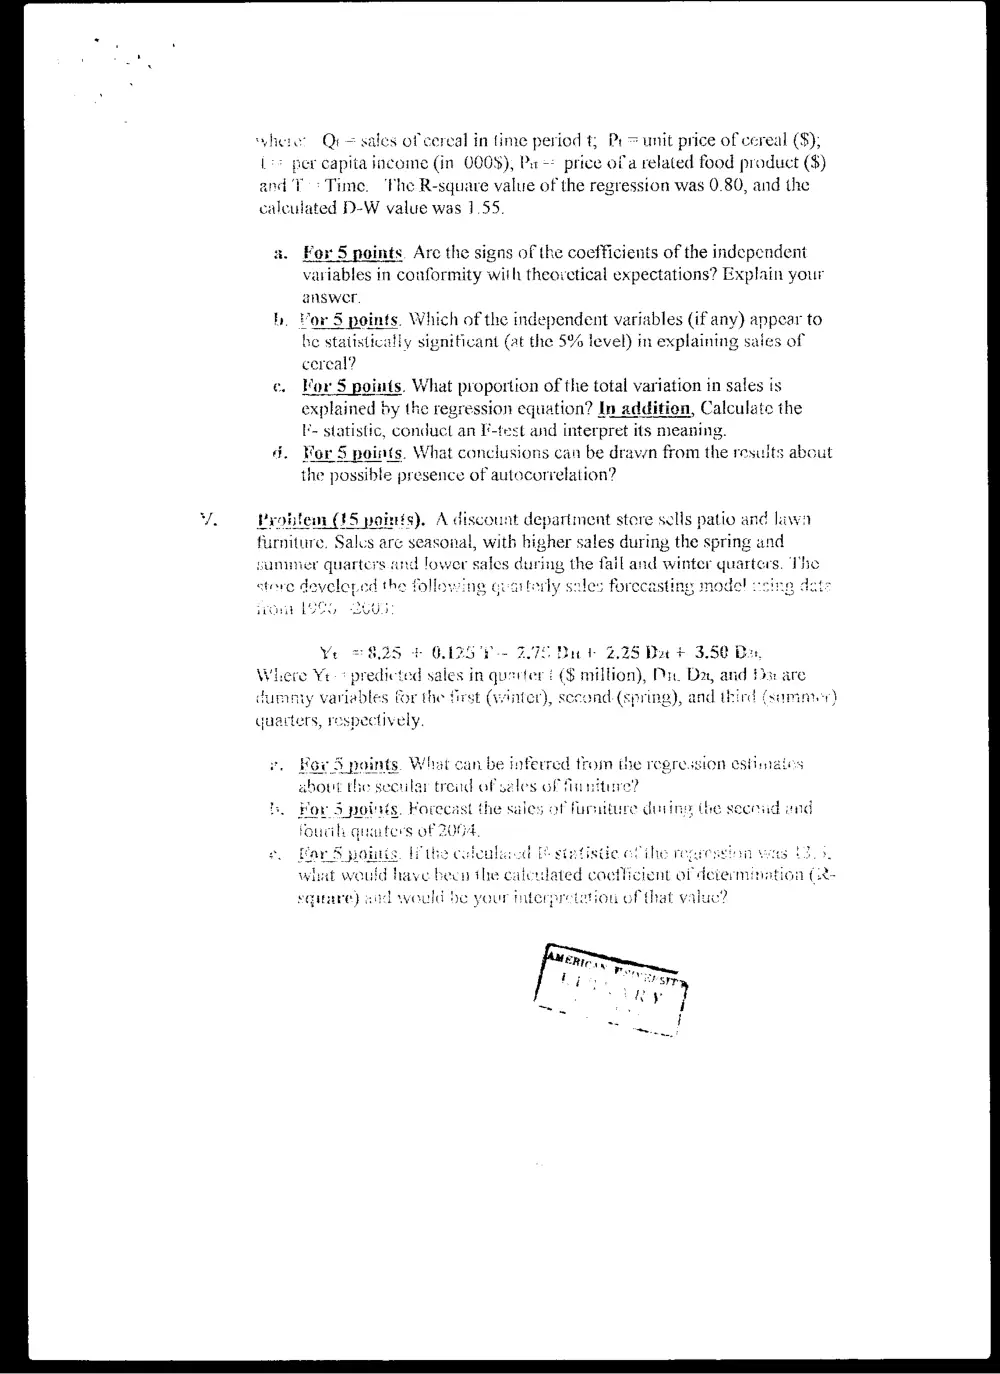
here Qt= sales of cereal in time period t; Pt = unit price of cereal ($);
+ per capita income (in O00), Pa - price ofa related food product ($)
and Y > Time. ‘The R-squave value of the regression was 0.80, and the
caleulated D-W value was 1.55.
a. For 5 points. Are the signs of the coefficients of the independent
variables in conformity with theovctical expectations? Explain your
answer.
Vor 5 points. Which of the independent variables (if any) anpear to
he statistically signiticant (at the 5% level) in explaining sales of
cereal?
Kor 5 points. What proportion of the total variation in sales is
explained by the regression equation? In additien, Calculate the
E- statistic, conduct an I'-test and interpret its meaning.
Kor 5 points. What conclusions can be drawn from the results about
the possible presence of autocorrelation?
yatem (ES poms), A discount department store sells patio and lawn
furniture. Salus arc seasonal, with higher sales during the spring and
sununer quarter {lower sales during the fail and winter quarters. ‘1’
store develored the following Guartorly sales forecasting model csing
£Y
rs)
_ Bales Seger
ehOHY bv UU
$25 + GARS bP - 278 Dict 2.25 Doe + 3.50 Bes,
Where Ye: predi sales in querer} ($ million), Di Das, and $33: are
dummy variables for the first (winter), second (spring), and third Gamnwr
quarters, respectively.
*6¢ 5 points. What can be inferred trom the regression esting
about the secular trond of sales of funiture?
“SS points. Forecast the sales of furniture during (te second ind
fourili quaiters of 20-4,
ifthe coloulaicd [ statisde eri 3 td
uihe calculated coetlicient of determination (
square) cad would be your interpretation of that valuc?
.3 ? t
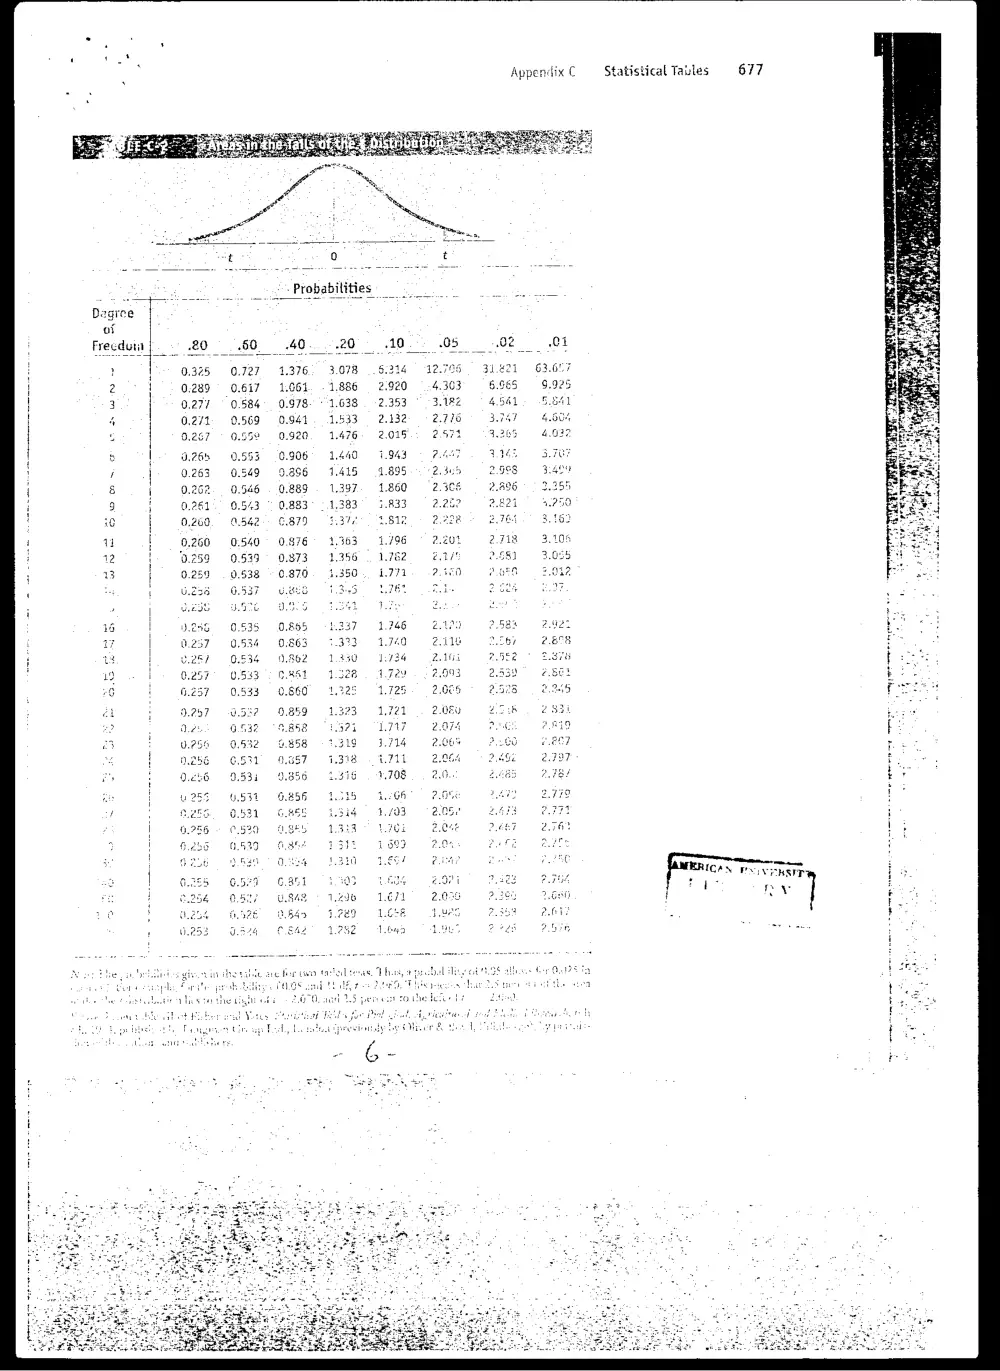
Appendix C tatistical Taules = 677
- Probabilities
of
Frecduia
SESH RNR PORE ee RA
F
(ALS
JOPLULTONSG
TT
t
H
sescgeeme pet compe map cininemn ne ms