
BUSS 230 Midterm, Fall 2003
American University of Beirut · Managerial Economics · 7 pages



More BUSS 230 files
- Midterm Solution · Fall 2013Exam · with solutionView
- Midterm · Fall 2013ExamView
- Midterm Review Questions Solution · Fall 2011Exam · with solutionView
- Midterm Review Questions · Fall 2011ExamView
- Midterm · Fall 2006ExamView
- Midterm · Fall 2005ExamView
- Midterm · Spring 2005ExamView
- Midterm · Spring 2004ExamView
Show the text of this exam
. ‘AMERICAN UNIVERSITY of BEIRUT
SCHOOL of BUSINESS
BUSS 230
MID-TERM EXAM - November 18, 2002
NAME: 1D:
SECTION: INSTRUCTOR:
ANSWER ALL QUESTIONS — TIME ALLOWED: 1 % hours
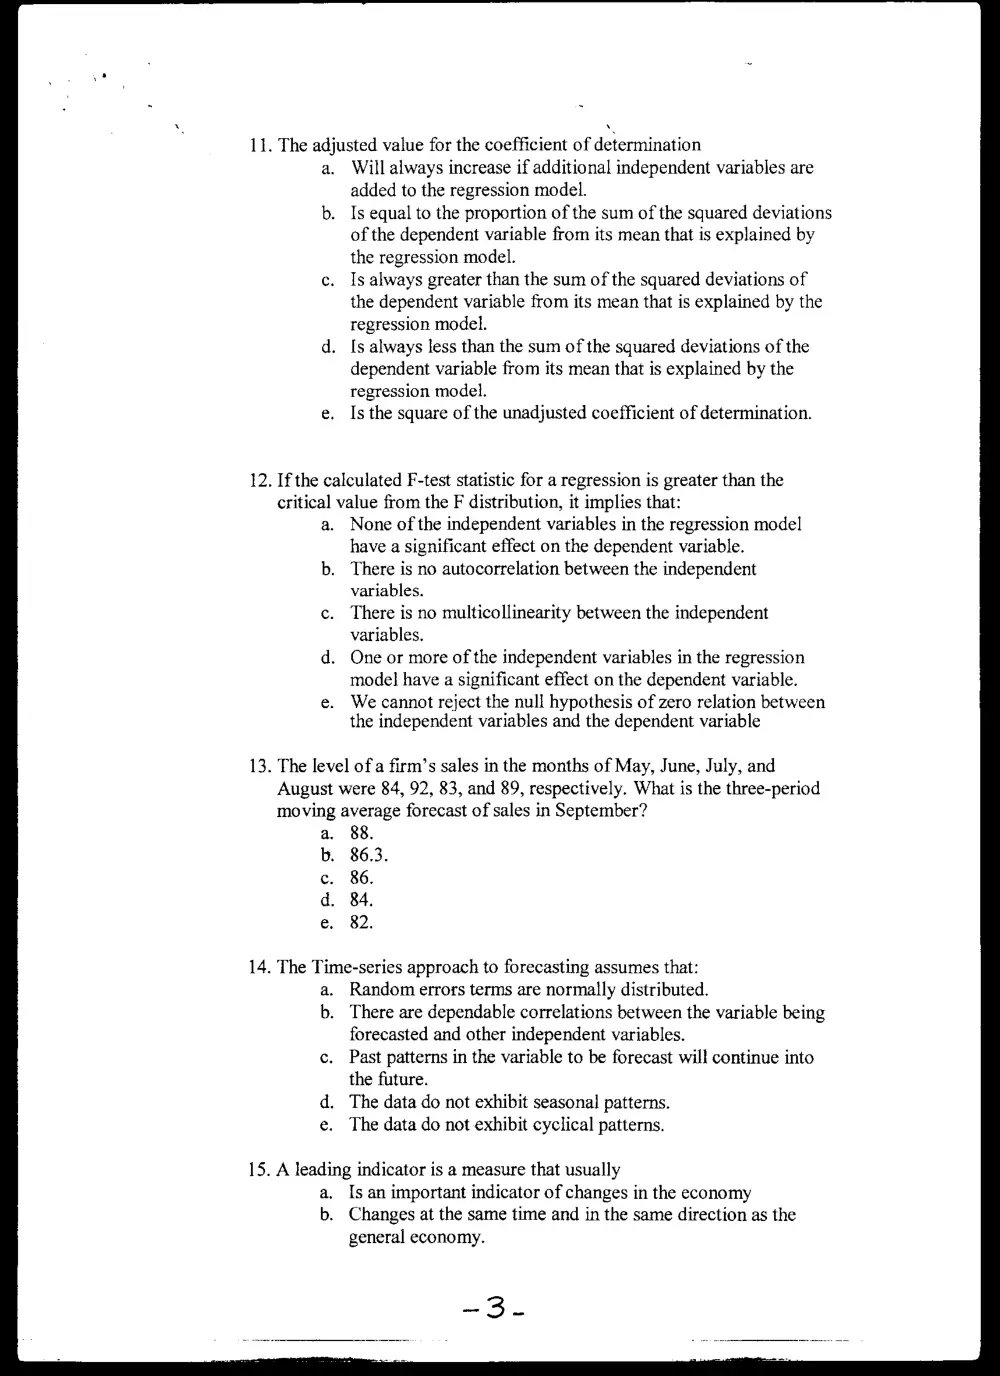
L Multiple choice - (30 points). Circle the correct answer
1. The modern theory of the firm postulates that the primary objective of
managers is to maximize:
. The firm’s total revenue.
. The value of the firm’s output.
. The present value of the firm’s expected future profits.
. The firm’s contribution to social welfare.
. The wealth of the firm’s employees and customers.
. Which of the following is the best definition of economic profit?
. Business profit minus implicit costs.
. Total revenue minus total explicit costs.
. Total revenue minus total implicit costs.
. Business profit minus explicit costs.
. Explicit revenues minus implicit costs.
. Ifthe price ofa good increases while the quantity of the good
exchanged on markets increases also, then the most likely explanation
is that there has been:
. An increase in demand.
. A decrease in demand.
. An increase in supply.
. A decrease in supply.
. A decrease in demand accompanied by an increase in supply.
. If marginal revenue is equal to zero, then:
Total profit is zero also:
b. Average revenue is zero also.
c. Total revenue is at a maximum.
d. Average revenue is at a maximum.
e. Total cost is at a minimum.
. The marginal principle asserts that, in general, when NET BENEFIT is
maximized
a. Total benefit will be equal to total cost.
b. Average benefit will be equal to average cost.
Cc.
d.
G.
Marginal benefit will be equal to marginal cost.
Average cost will be above average revenue but below
average benefit.
Total benefit will be at a maximum.
6. Ifboth average cost (AC) and marginal cost (MC) are U shaped, then
a.
b.
c
d.
e.
AC will reach a minimum at a level of output that is less than
that at which MC reaches a minimum.
The total cost curve will be a straight line.
AC will reach a minimum at a level of output that is greater
than that at which MC reaches a minimum.
Both AC and MC will reach a minimum at the same level of
output.
AC will be always below MC.
. Assuming a demand function of the form Q = 24 - 2P. AtP = 6, the
price elasticity of demand is:
There i is not enough information to arrive at an answer.
_ As the economic recession worsened in 2001, household income fell
by 5%. Over the same period, total expenditures on automobile repairs
increased by 3%. Assuming no change in all other economic variables
affecting houschold expenditures :
The income elasticity of demand is equal to 0.6.
. Automobile repairs must be a normal good.
Automobile repairs must be an inferior good.
. The price elasticity of demand for automobile repairs is equal
to -5/3.
The price elasticity of demand for automobile repairs is equal
to -3
. Ifthe price of a good increases, then
a.
b.
c.
d.
e.
The demand for complementary goods will increase.
The demand for the good will increase.
The demand for substitute goods will decrease.
The demand for the good will decrease.
Total expenditures on the good will increase.
-_—. 10. Application of simple linear regression analysis to the estimation ofa
demand function yielded the following result: Q = 24 - 2P. Ifat the
price P = 6, was Q = 10, then the crror (e) for that price/quantity
observation is:
Zero.
‘
11. The adjusted value for the coefficient of determination
a. Will always increase if additional independent variables are
added to the regression model.
b. Is equal to the proportion of the sum of the squared deviations
of the dependent variable from its mean that is explained by
the regression model.
Is always greater than the sum of the squared deviations of
the dependent variable from its mean that is explained by the
regression model.
. Is always less than the sum of the squared deviations of the
dependent variable from its mean that is explained by the
regression model.
e. Is the square of the unadjusted coefficient of determination.
12. If the calculated F-test statistic for a regression is greater than the
critical value from the F distribution, it implies that:
a. None of the independent variables in the regression model
have a significant effect on the dependent variable.
b. There is no autocorrelation between the independent
variables.
There is no multicollinearity between the independent
variables.
One or more of the independent variables in the regression
model have a significant effect on the dependent variable.
We cannot reject the null hypothesis of zero relation between
the independent variables and the dependent variable
13. The level of a firm’s sales in the months of May, June, July, and
August were 84, 92, 83, and 89, respectively. What is the three-period
moving average forecast of sales in September?
88.
86.3.
86.
84.
82.
14. The Time-series approach to forecasting assumes that:
a. Random errors terms are normally distributed.
b. There are dependable correlations between the variable being
forecasted and other independent variables.
c. Past patterns in the variable to be forecast will continue into
the future.
d. The data do not exhibit seasonal patterns.
e. The data do not exhibit cyclical patterns.
15. A leading indicator is a measure that usually
a. Is an important indicator of changes in the economy
b. Changes at the same time and in the same direction as the
general economy.
Changes in the same direction as the general economy before
the general economy changes.
. Causes changes in the general economy.
Indicates the performance of the leading industries of the
economy.
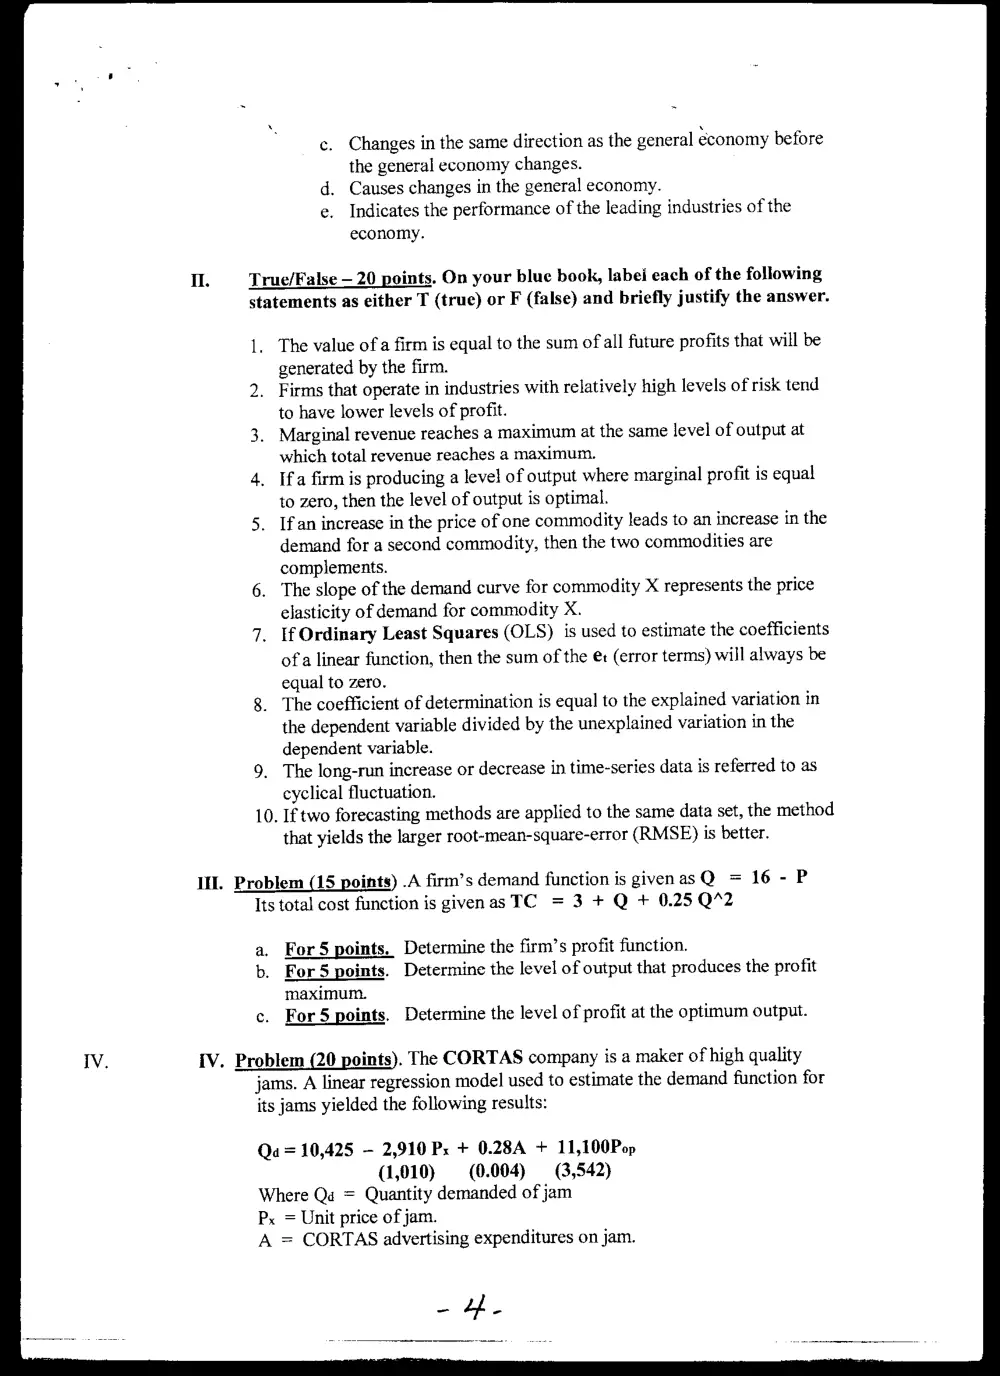
True/False — 20 points. On your blue book, labei each of the following
statements as either T (true) or F (false) and briefly justify the answer.
L.
2.
The value of a firm is equal to the sum of all future profits that will be
generated by the firm.
Firms that operate in industries with relatively high levels of risk tend
to have lower levels of profit.
. Marginal revenue reaches a maximum at the same level of output at
which total revenue reaches a maximum.
. Ifa firm is producing a level of output where marginal profit is equal
to zero, then the level of output is optimal.
_ [fan increase in the price of one commodity leads to an increase in the
demand for a second commodity, then the two commodities are
complements.
. The slope of the demand curve for commodity X represents the price
elasticity of demand for commodity X.
. If Ordinary Least Squares (OLS) is used to estimate the coefficients
ofa linear function, then the sum of the et (error terms) will always be
equal to zero.
_ The coefficient of determination is equal to the explained variation in
9.
10.
the dependent variable divided by the unexplained variation in the
dependent variable.
The long-run increase or decrease in time-series data is referred to as
cyclical fluctuation.
If two forecasting methods are applied to the same data set, the method
that yields the larger root-mean-square-error (RMSE) is better.
Il. Problem (15 points) .A firm’s demand function is givenasQ = 16 - P
Its total cost function is givenas TC = 3 + Q + 0.25 Q%2
a.
b.
c.
For 5 points. Determine the firm’s profit function.
For 5 points. Determine the level of output that produces the profit
maximum.
For 5 points. Determine the level of profit at the optimum output.
IV. Problem (20 points). The CORTAS company is a maker of high quality
jams. A linear regression model used to estimate the demand function for
its jams yielded the following results:
Qa = 10,425 — 2,910 Px + 0.28A + 11,100Pop
(1,010) (0.004) (3,542)
Where Qe = Quantity demanded of jam
Px
= Unit price of jam.
A = CORTAS advertising expenditures on jam.
_ Ye
x
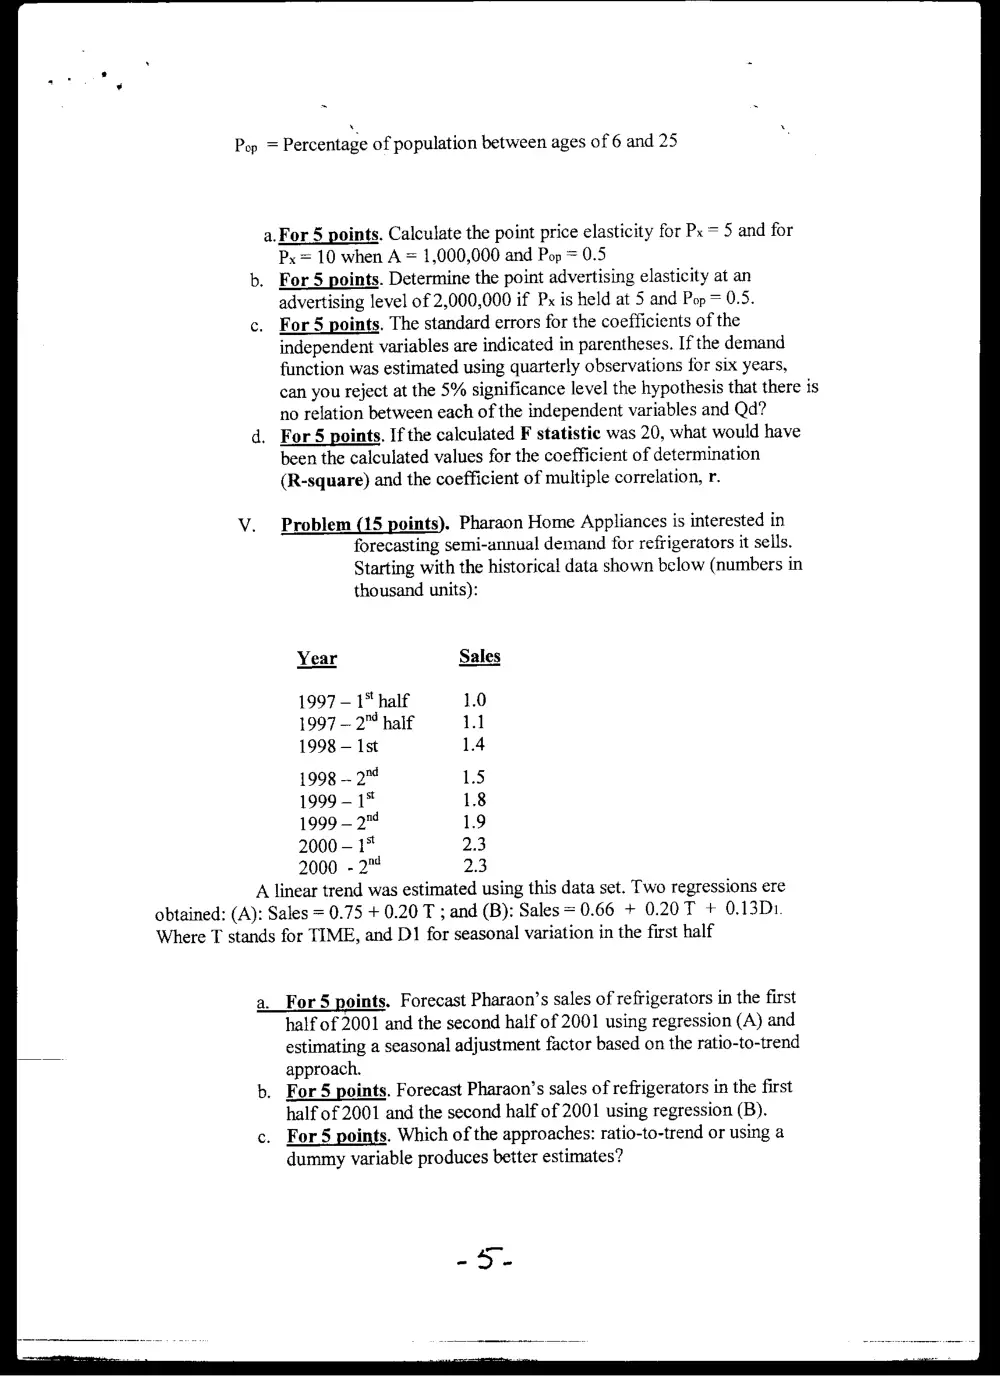
Pop = Percentage of population between ages of 6 and 25
a.For 5 points. Calculate the point price elasticity for Px = 5 and for
Px = 10 when A = 1,000,000 and Pop = 0.5
. For 5 points. Determine the point advertising elasticity at an
advertising level of 2,000,000 if Px is held at 5 and Pop = 0.5.
. For 5 points. The standard errors for the coefficients of the
independent variables are indicated in parentheses. If the demand
function was estimated using quarterly observations for six years,
can you reject at the 5% significance level the hypothesis that there is
no relation between each of the independent variables and Qd?
. For 5 points. If the calculated F statistic was 20, what would have
been the calculated values for the coefficient of determination
(R-square) and the coefficient of multiple correlation, r.
Problem (15 points). Pharaon Home Appliances is interested in
forecasting semi-annual! demand for refrigerators it sells.
Starting with the historical data shown below (numbers in
thousand units):
Year Sales
1997 — 1" half 1.0
1997 — 2™ half 1.1
1998 — Ist 1.4
1998 — 24 1.5
1999 - 1* 1.8
1999-2" 1.9
2000 — 1° 2.3
2000 - 2™ 2.3
A linear trend was estimated using this data set. Two regressions ere
obtained: (A): Sales = 0.75 + 0.20 T ; and (B): Sales = 0.66 + 0.20 T + 0.13D1.
Where T stands for TIME, and D1 for seasonal variation in the first half
a._For 5 points, Forecast Pharaon’s sales of refrigerators in the first
half of 2001 and the second half of 2001 using regression (A) and
estimating a seasonal adjustment factor based on the ratio-to-trend
approach.
b. For 5 points. Forecast Pharaon’s sales of refrigerators in the first
half of 2001 and the second half of 2001 using regression (B).
c. For5 points. Which of the approaches: ratio-to-trend or using a
dummy variable produces better estimates?
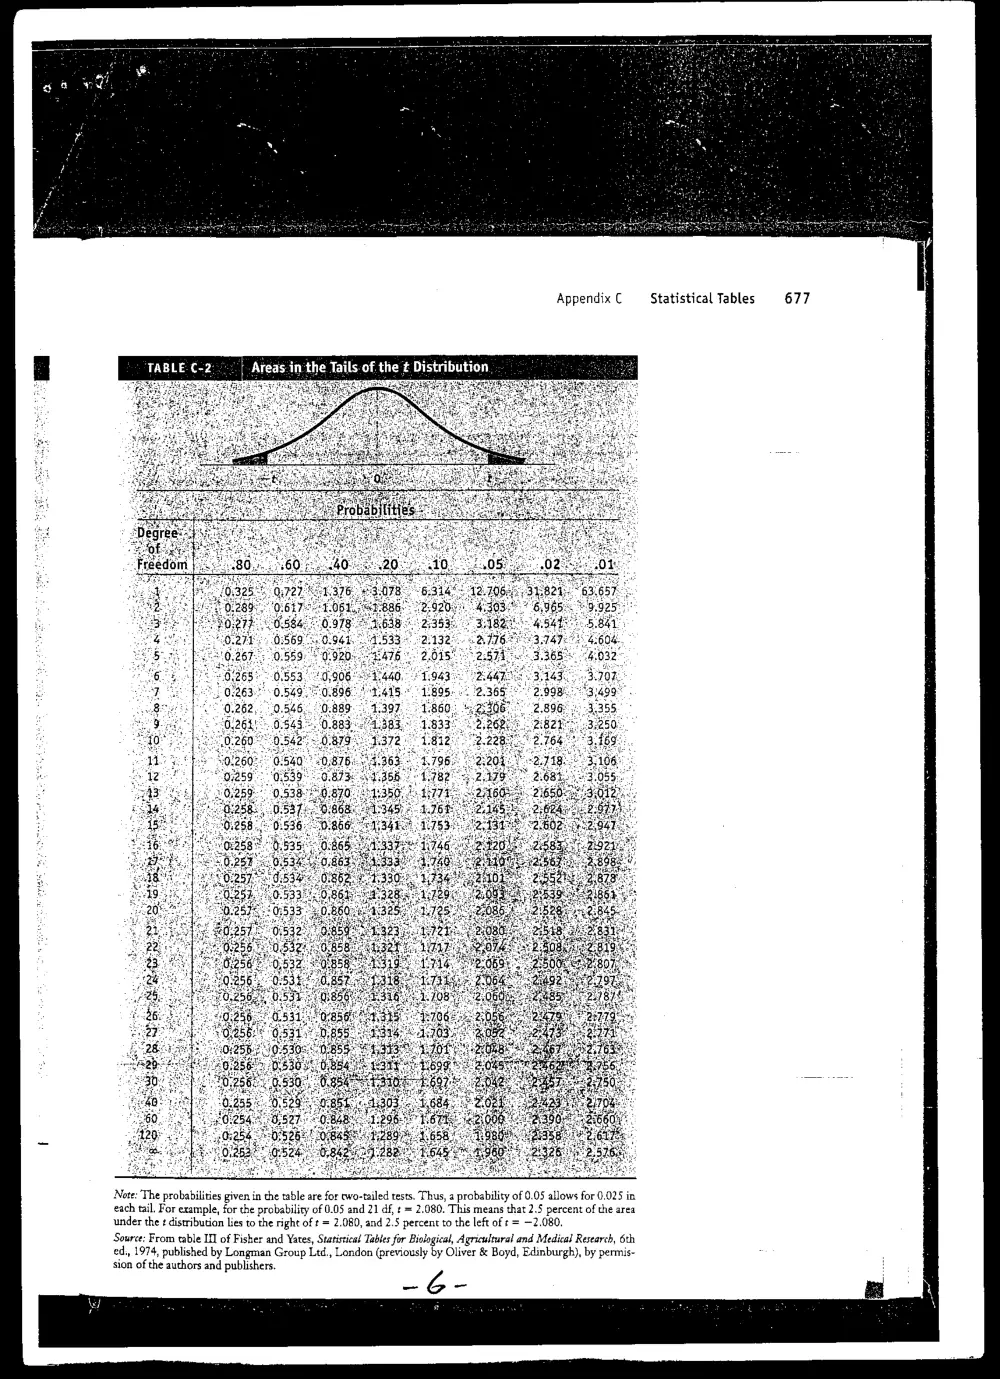
Appendix C Statistical Tables 677
Note: The probabilities given in the table are for ewo-tailed tests. Thus, a probability of 0.05 allows for 0.025 in
each tail. For example, for the probability of 0.05 and 21 df, t = 2.080. This means that 2.5 percent of the area
under the ¢ distribution lies to the right of t = 2.080, and 2.5 percent to the left of t = —2.080.
Source: From table II] of Fisher and Yates, Statistical Tables for Biological, Agricultural and Medical Research, 6th
ed., 1974, published by Longman Group Ltd., London (previously by Oliver & Boyd, Edinburgh), by permis-
sion of the authors and publishers. S
Degrees of Freedom for Numerator
5 6 7 8 9 10 12 15
161 200 216 225 230 234 237 239 241 242 244 246 248 249 250 251 252
18.5 19.0 19.2 19.2 19.300 19.3 194 194 194 194 194 19.4 19.5 19.5 19.5 19.5 19.5
1.1 9.55 9.28 9.12 9.01 8.94 8.89 8.85 8.81 8.79 8.74 8.70 8.66 8.64 8.62 8.59 8.57
7.71 6.94 6.59 6.39 6.26 6.16 6.09 6.04 6.00 5.96 5.91 5.86 5.80 5.77 5.75 5.72 5.69
6.61 5.79 5.41 5.19 5.05 4.95 4.88 4.82 477 4.74 4.68 4.62 4.56 4.53 4.50 4.46 4.43
5.99 5.14 4.76 4.53 4.39 4,28 4.21 415 410 4.06 4.00 3.94 3.87, 3.84 3.81 3.77 3.74
5.59 4.74 435 422 3.97 3.87 3.79 3.73 3.68 = 3.64 3.57 3.51 3.44 3.44 3.38 3.34° 3.30
5.32 446 4.07 3.84 3.69 3.58 3.50 3.44 3.39 3.35 3.28 3.22 3.15 3.12 3.08 3.04, 3.01
5.12 4.26 3.86 3.63 3.48 3.37 3.29 3.230 3.18 93.14 3.07 3.01 2.94 2.90 2.86 2.83, 2.79
4.96 410 3.71 3.48 3.33 3.22 3.14 3.07 3.02 2.98 2.91 2.85 2.77 2.74 2.70 2.66! 2.62
4.84 3.98 3.59 3.36 3.20 3.09 3.01 2.95 2.90 2.85 2.79 2.72 2.65 2.61 2.57 2.53 2.49
4.75 3.89 3.49 3.26 3,11 3.00 2.91 2.85 2.80 2.75 2.69 2.62 2.54 2.51 2.47 2.43° 2.38
4.67 3.81 3.41 3.18 3.03 2.92 2.83 2.77 2.71 2.67 2.60 2.53 2.46 2.42 2,38. 2.34:. 2.30
4.60 3.74 3.34 ° 3.11 2.96 2.85 2.76 2.70 2.65 2.60 2.53 2.46 2.39 2:35 2.31 2.27. 2.22
4.54 3.68 — 3.29- . 3.06 2.90 2.79 271 2.64 259 2.54 2.48 2.40 2.33 > 2.29 2.25 2.20 2.16
449° 3,63 3.24 3.01 2.85 2.74 2.66 2.59 2.54 2.49 2.42 2.35 2.28 2.24 2.19 2.15 2.11
445 53,59 3.20. 2.96 2.81 2.70 2.61 2.55 2.48 2.45 2.38 2.31 2.23. 2.19 2.15° 2.10 | 2.06
A4L. 3.55°- 3,16 2.93 2.77 2.66 258 2.51 2.46 2.41 2.34 © 2.27 2.19. 2.15 2.11 2.06 © 2:02
4.38 3.52 3.13 2.90 2.74 2.63 2.54 248 2.42 2.39 2.31. 2.23 2.16: 2.41 2.07: 2.03. 1.98
4.35 3.49. 3,10 2.87 2.71 2.60 2.51 2.45 2.39 2.35 2.28 2.20 2.12. 2.08 2.04 1.99 1.95
4.32 ..3.47. 3.07...2.84 2.68 2.57 2.49 2.42 2.37 2,32 2.25 2.18 2.10° °2.05°°. 2.01 1:96°...4.92
4.30. 3144. 3.05. 2.82 2.66 2.55 246 240 2.34 2.30 2.23 2.15 2.07. 2,03... 1.98 1.94: ; 2:89
4.28 3.42. 3.03 2.80 2.64 2.53 2.44 2.37 2.32 2.27 2.20) 2.13 2,05 -.) 2:01 1.96 1.94. -2.86
4.26 3.40 - 3.02 2.78 . 2.62 2.51 2.42 236 2.30 2.25 2.18 2.41 2,03, --1.98 1.94 4.89 1.84
4.24 23,39. 2.99 2:76 2.60 2.49 2:40 2.34 2.28 2.24 - 2.16 2.09 2.01. 1.96 892.07 1.87. 182:
5
g
%
£
=
°
2
5
a
5
s
—E
c=]
a.
3
8
e
&
ba
°o
a
3
Hy
&
o
a
417° »3.32 2.92) 2.69 2,53 2.42 2.330 2.27) 2.21 2.16 2.09 2.02 1.93. 1.89 1:84. 1.79" “2.74
4.08 3.23 © 2.84 2.61 2.45 2.34 225 2.38 2.12 2.08 2.00 1.92 1.84 -1.79 1.74 1.69" 7.64
4.00° 3.15. 2.76 = 2.53 2.37 2.25 2.17 2.10 2.04 1.99 1.92 1.84 1.75°°-1.70 1.65 159° * 1:53.
3.92 3.07 2.68 - 2.45 2.29 2.18 2.09 2.02 1.96 1.91 1.83 1.75 1.66 1.61 1.55 1.50 -.-1.43.
3.84 3.00 2.60 2.37 2.21 2.10 2.01 1.94 1.88 1.83 1.75 1.67 1.57. 1.52 1.46. 1.39) 4.3255 1:22
M. Merrington and C. M. Thompson, “Tables of Percentage Points of the Inverted Beta (F) Distribution,” Biometrica, vol. 33, 1943, p. 73.