
EECE 340 Homework Solution to Problem Set 1, Summer 2011
American University of Beirut · Signals and Systems · 10 pages · Dr. Fadi Karameh · with solution




More EECE 340 files
- Homework 3 · Spring 2016HomeworkView
- Homework 1 Solution · Spring 2016Homework · with solutionView
- Homework 4 · Spring 2016HomeworkView
- Homework 3 Solution · Spring 2016Homework · with solutionView
- Homework 4 Solution · Spring 2016Homework · with solutionView
- Homework 1 · Spring 2016HomeworkView
- Homework 2 Solution · Spring 2016Homework · with solutionView
- Homework 2 · Spring 2016HomeworkView
Show the text of this homework
AMERICAN UNIVERSITY OF BEIRUT
Department of Electrical and Computer Engineering
EECE340- Spring 2011
Prof. Karameh
Problem 1
Problem 2
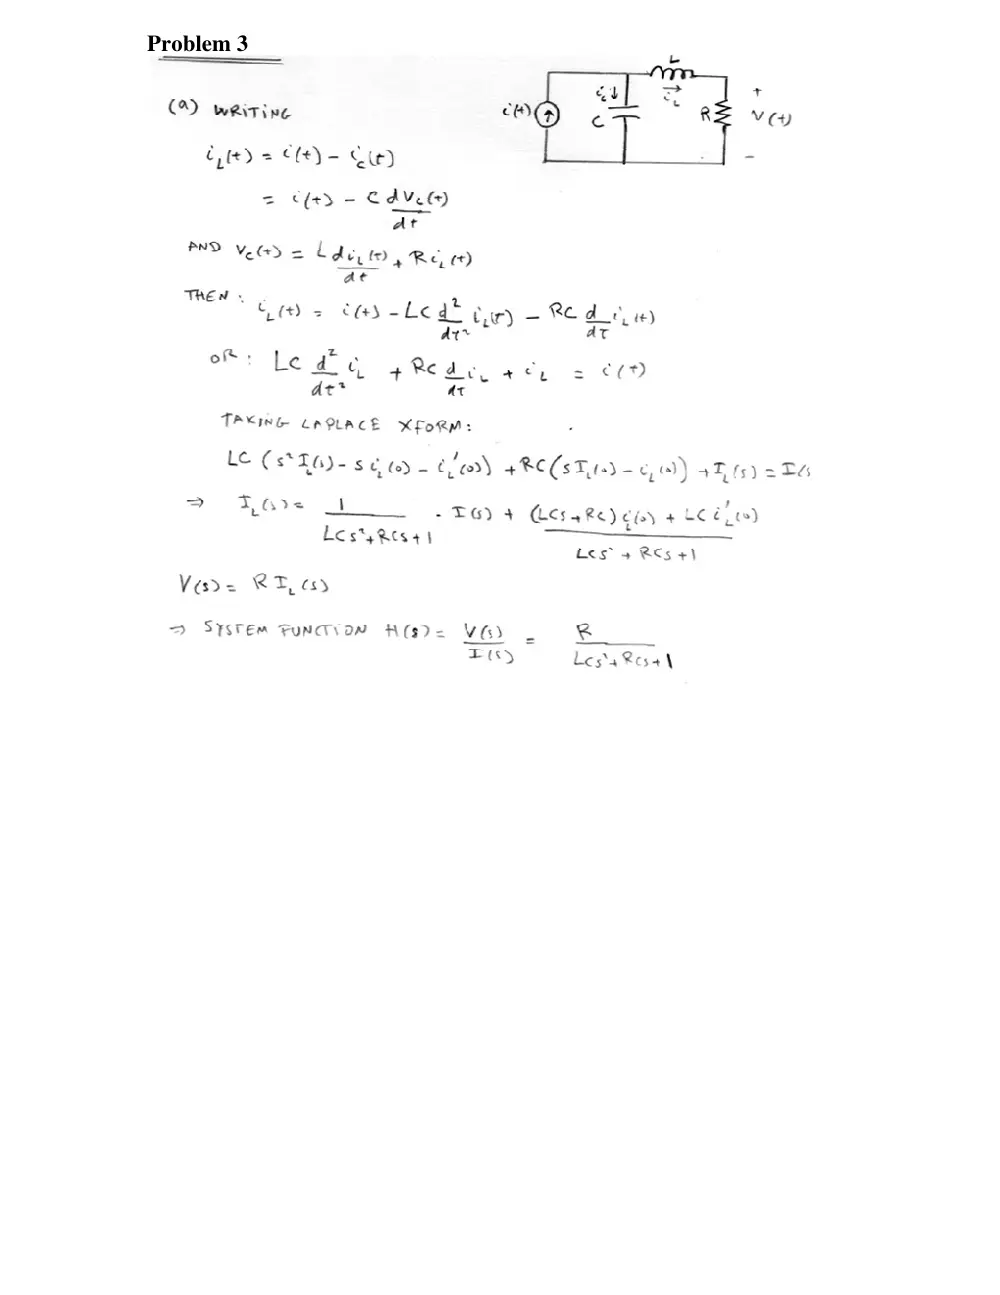
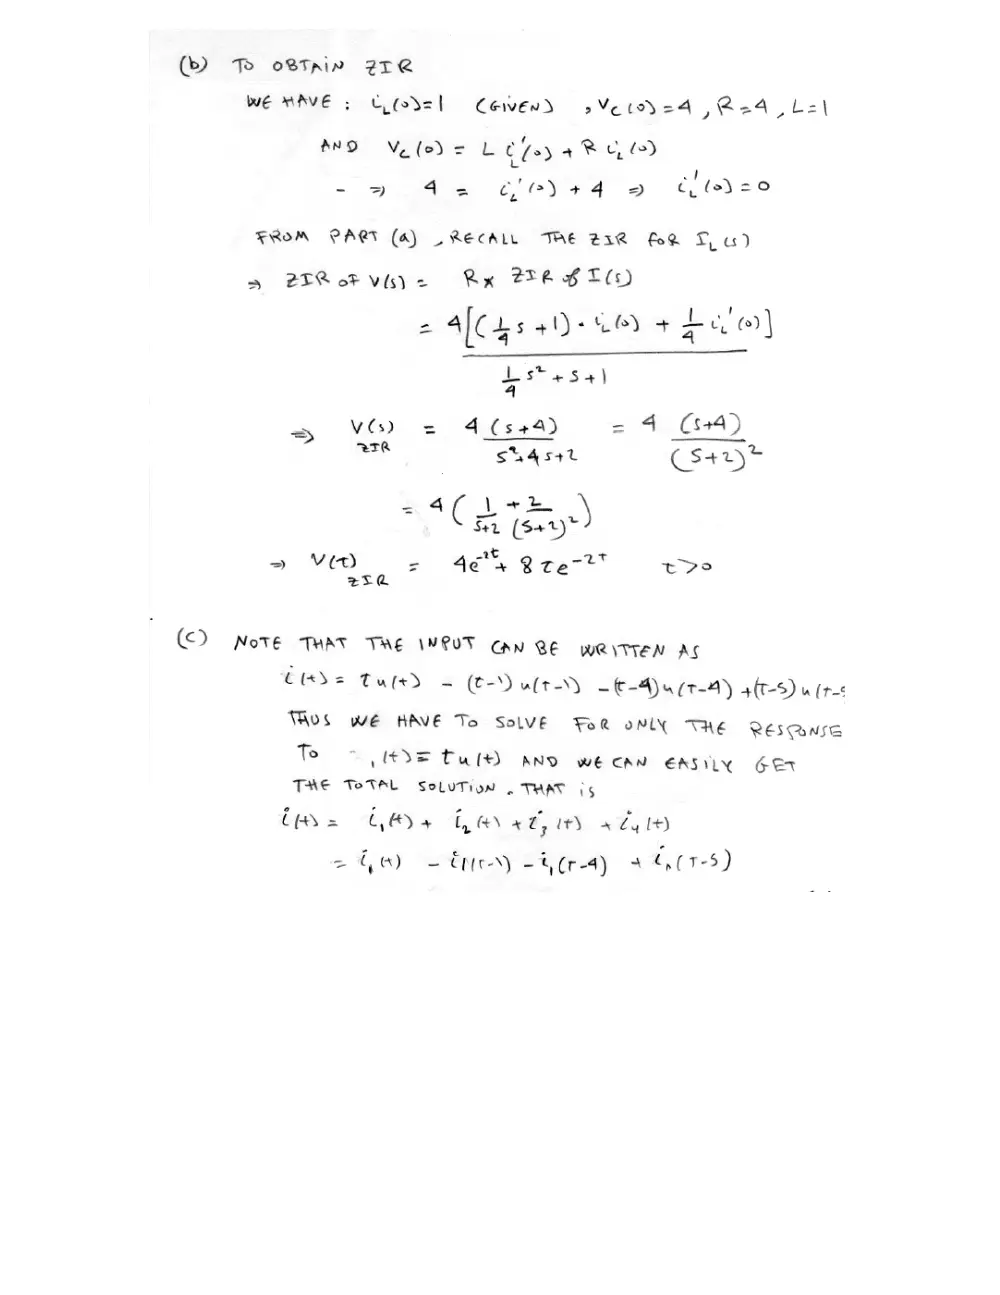
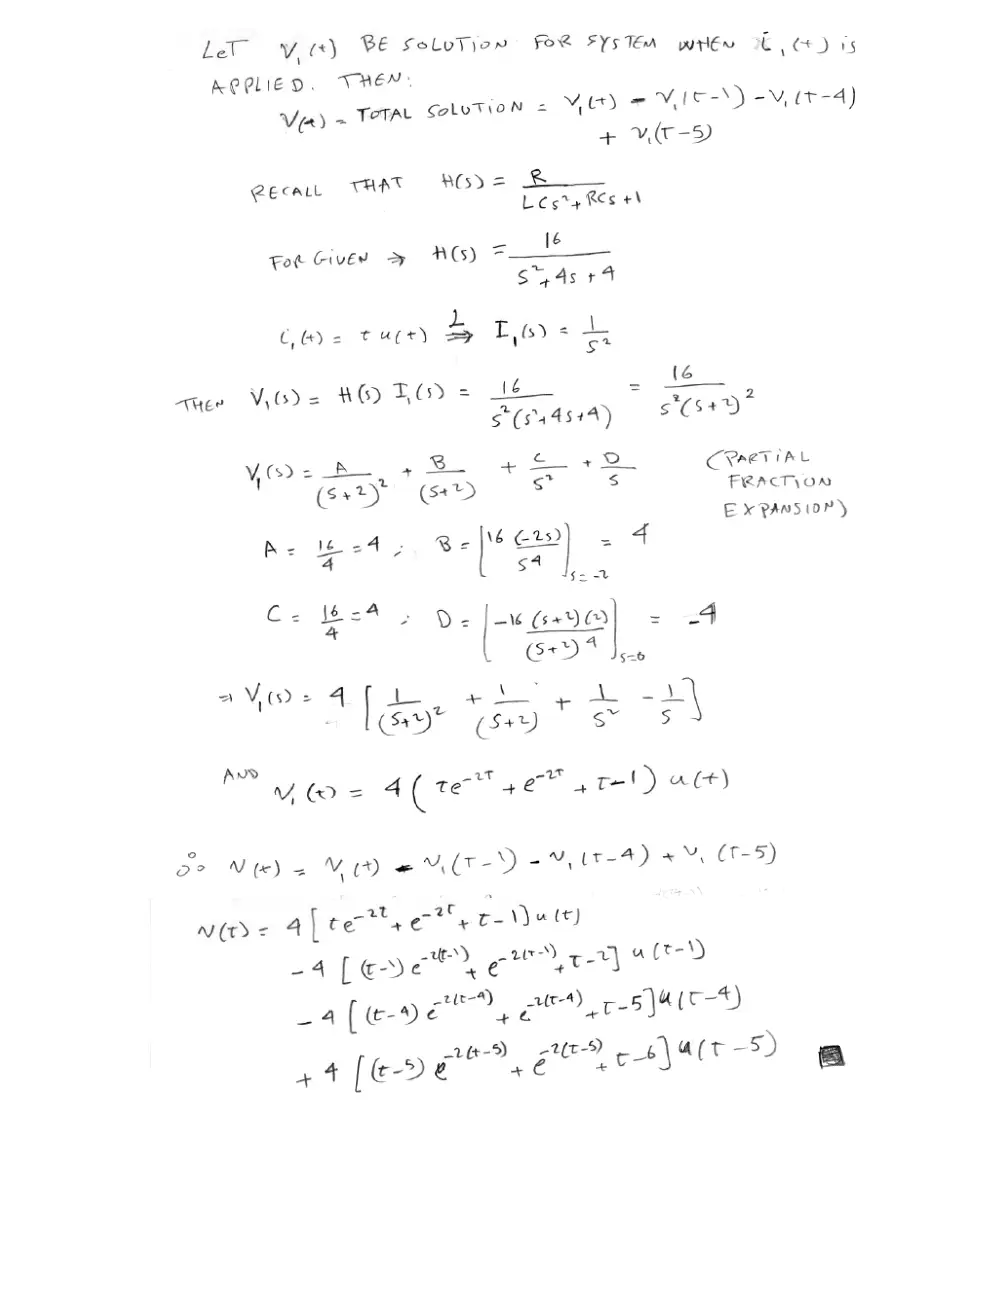
Problem 3
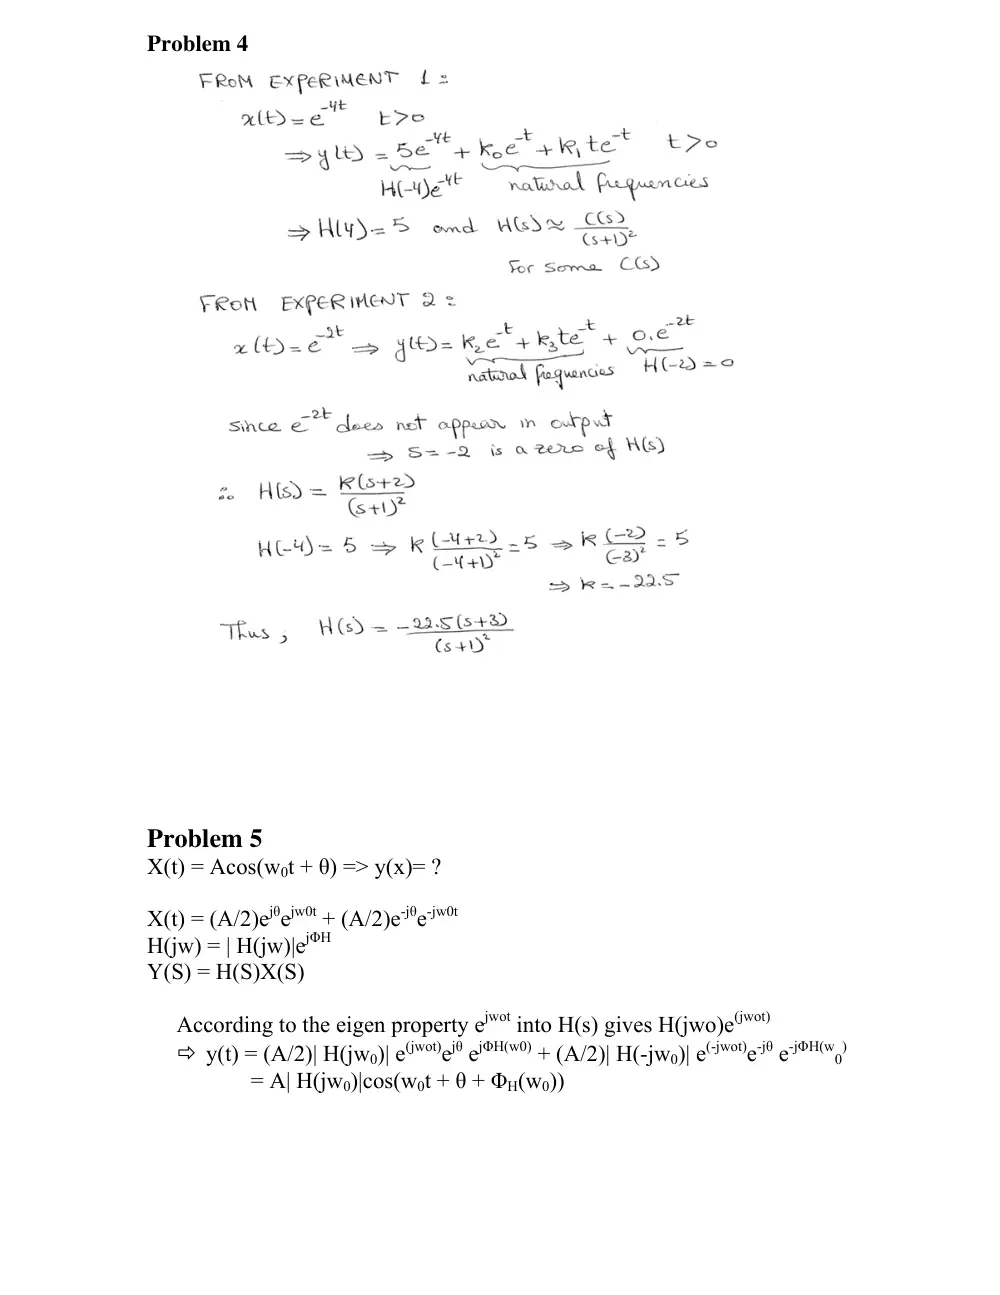
Problem 4
Problem 5
X(t) = Acos(w0t + θ) => y(x)= ?
X(t) = (A/2)ejθejw0t + (A/2)e-jθe-jw0t
H(jw) = | H(jw)|ejΦH
Y(S) = H(S)X(S)
According to the eigen property ejwot into H(s) gives H(jwo)e(jwot)
� y(t) = (A/2)| H(jw0)| e(jwot)ejθ ejΦH(w0) + (A/2)| H(-jw0)| e(-jwot)e-jθ e-jΦH(w
0
)
= A| H(jw0)|cos(w0t + θ + ΦH(w0))
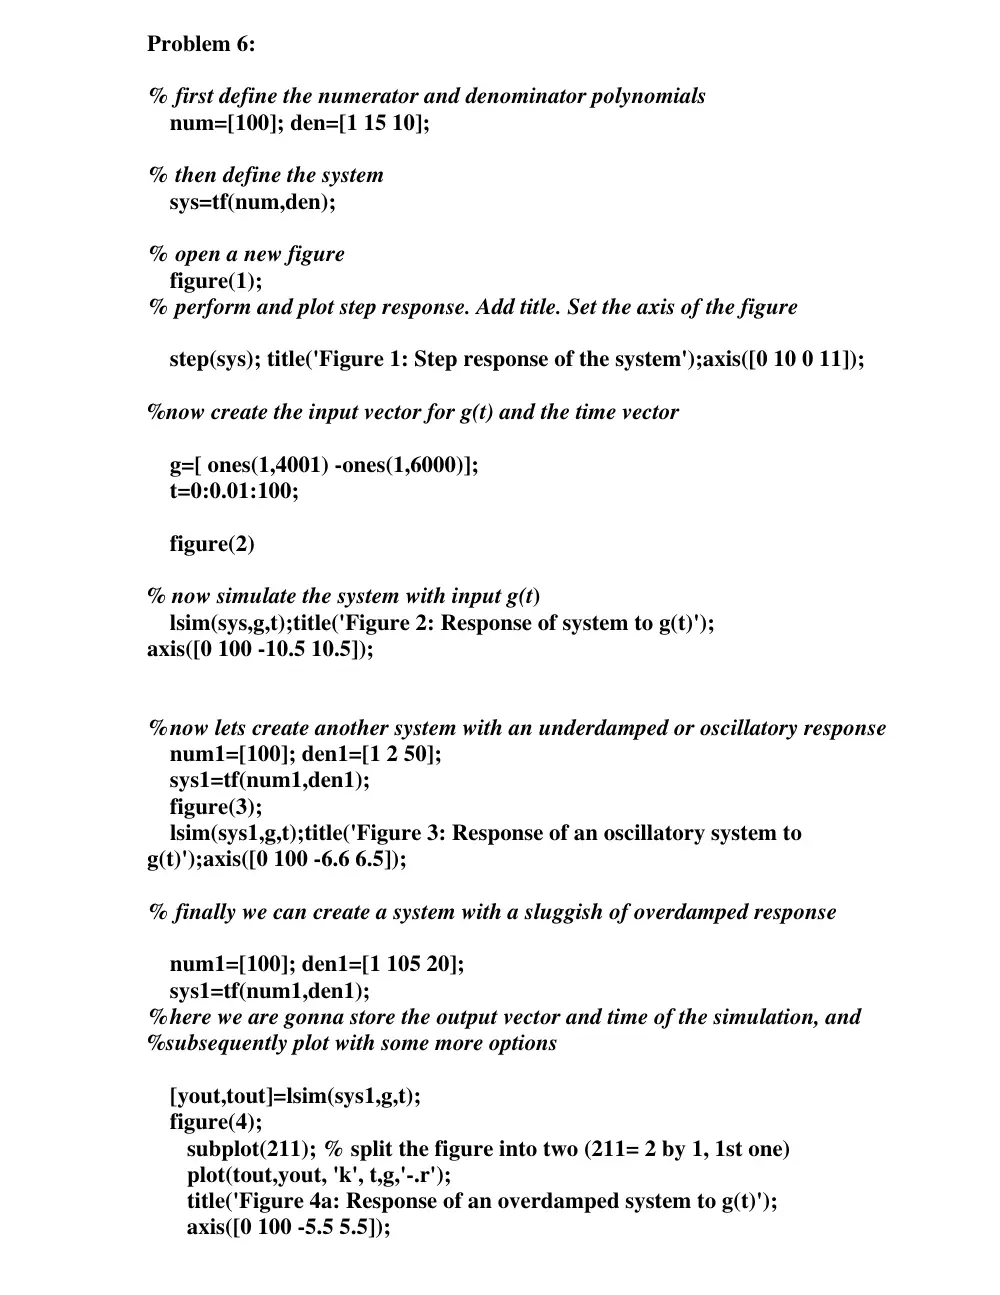
Problem 6:
% first define the numerator and denominator polynomials
num=[100]; den=[1 15 10];
% then define the system
sys=tf(num,den);
% open a new figure
figure(1);
% perform and plot step response. Add title. Set the axis of the figure
step(sys); title('Figure 1: Step response of the system');axis([0 10 0 11]);
%now create the input vector for g(t) and the time vector
g=[ ones(1,4001) -ones(1,6000)];
t=0:0.01:100;
figure(2)
% now simulate the system with input g(t)
lsim(sys,g,t);title('Figure 2: Response of system to g(t)');
axis([0 100 -10.5 10.5]);
%now lets create another system with an underdamped or oscillatory response
num1=[100]; den1=[1 2 50];
sys1=tf(num1,den1);
figure(3);
lsim(sys1,g,t);title('Figure 3: Response of an oscillatory system to
g(t)');axis([0 100 -6.6 6.5]);
% finally we can create a system with a sluggish of overdamped response
num1=[100]; den1=[1 105 20];
sys1=tf(num1,den1);
%here we are gonna store the output vector and time of the simulation, and
%subsequently plot with some more options
[yout,tout]=lsim(sys1,g,t);
figure(4);
subplot(211); % split the figure into two (211= 2 by 1, 1st one)
plot(tout,yout, 'k', t,g,'-.r');
title('Figure 4a: Response of an overdamped system to g(t)');
axis([0 100 -5.5 5.5]);
[ystep,tstep]=step(sys1);
subplot(212);
plot(tstep,ystep);
title('Figure 4b: Step Response of an overdamped system ');
axis([0 30 0 5.5]);
% add some more info to the last plot
xlabel('time (sec)'); ylabel('y(t)');
OUTPUT: