
EECE 340 Homework, Spring 2008
American University of Beirut · Signals and Systems · 4 pages
More EECE 340 files
- Homework 3 · Spring 2016HomeworkView
- Homework 1 Solution · Spring 2016Homework · with solutionView
- Homework 4 · Spring 2016HomeworkView
- Homework 3 Solution · Spring 2016Homework · with solutionView
- Homework 4 Solution · Spring 2016Homework · with solutionView
- Homework 1 · Spring 2016HomeworkView
- Homework 2 Solution · Spring 2016Homework · with solutionView
- Homework 2 · Spring 2016HomeworkView
Show the text of this homework
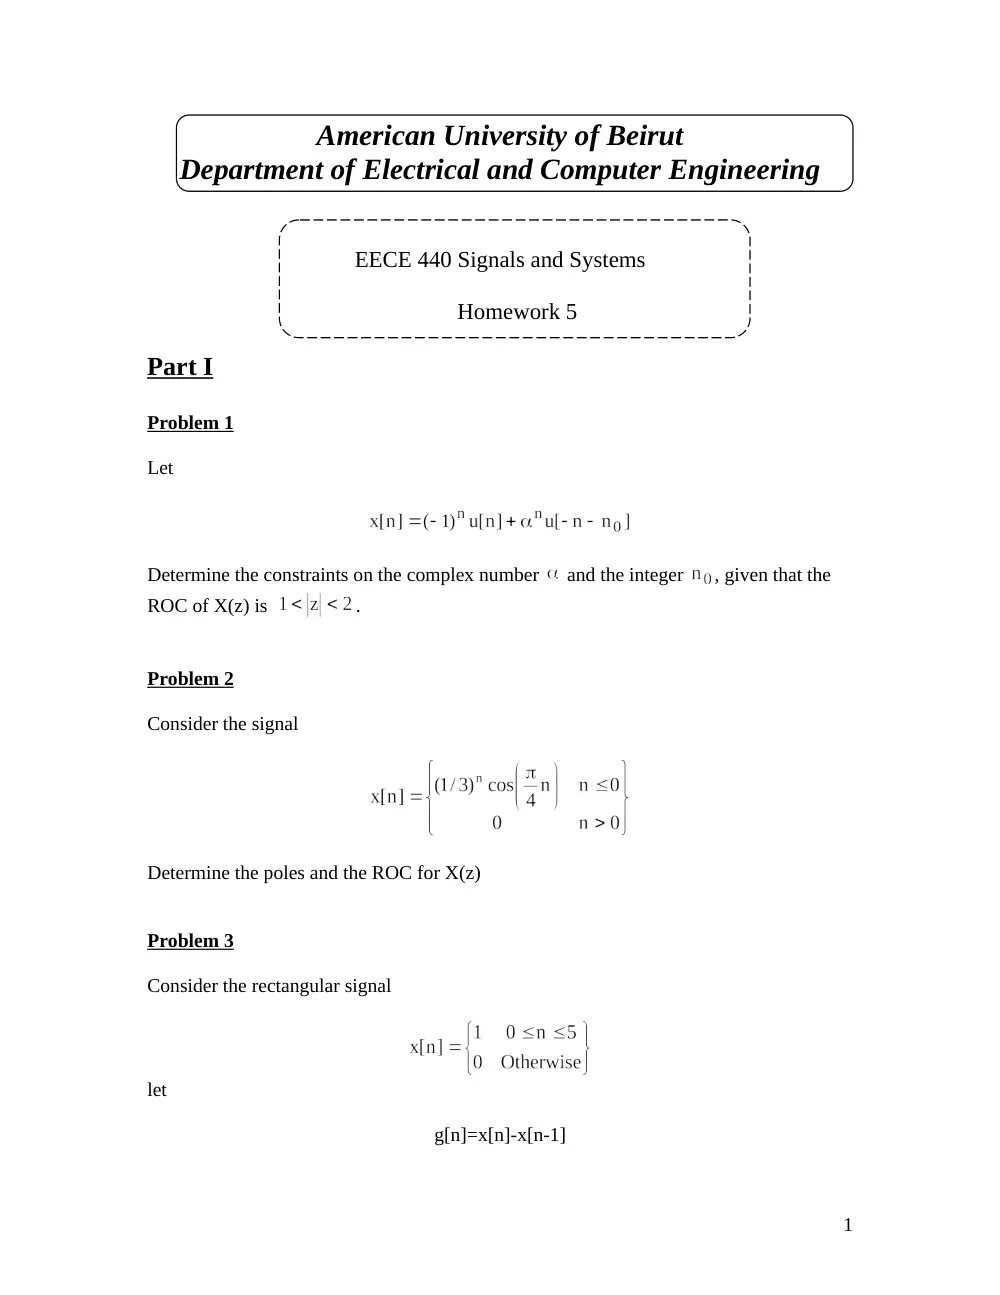
American University of Beirut
Department of Electrical and Computer Engineering
EECE 440 Signals and Systems
Homework 5
Part I
Problem 1
Let
Determine the constraints on the complex number
and the integer
, given that the
ROC of X(z) is
.
Problem 2
Consider the signal
Determine the poles and the ROC for X(z)
Problem 3
Consider the rectangular signal
let
g[n]=x[n]-x[n-1]
1
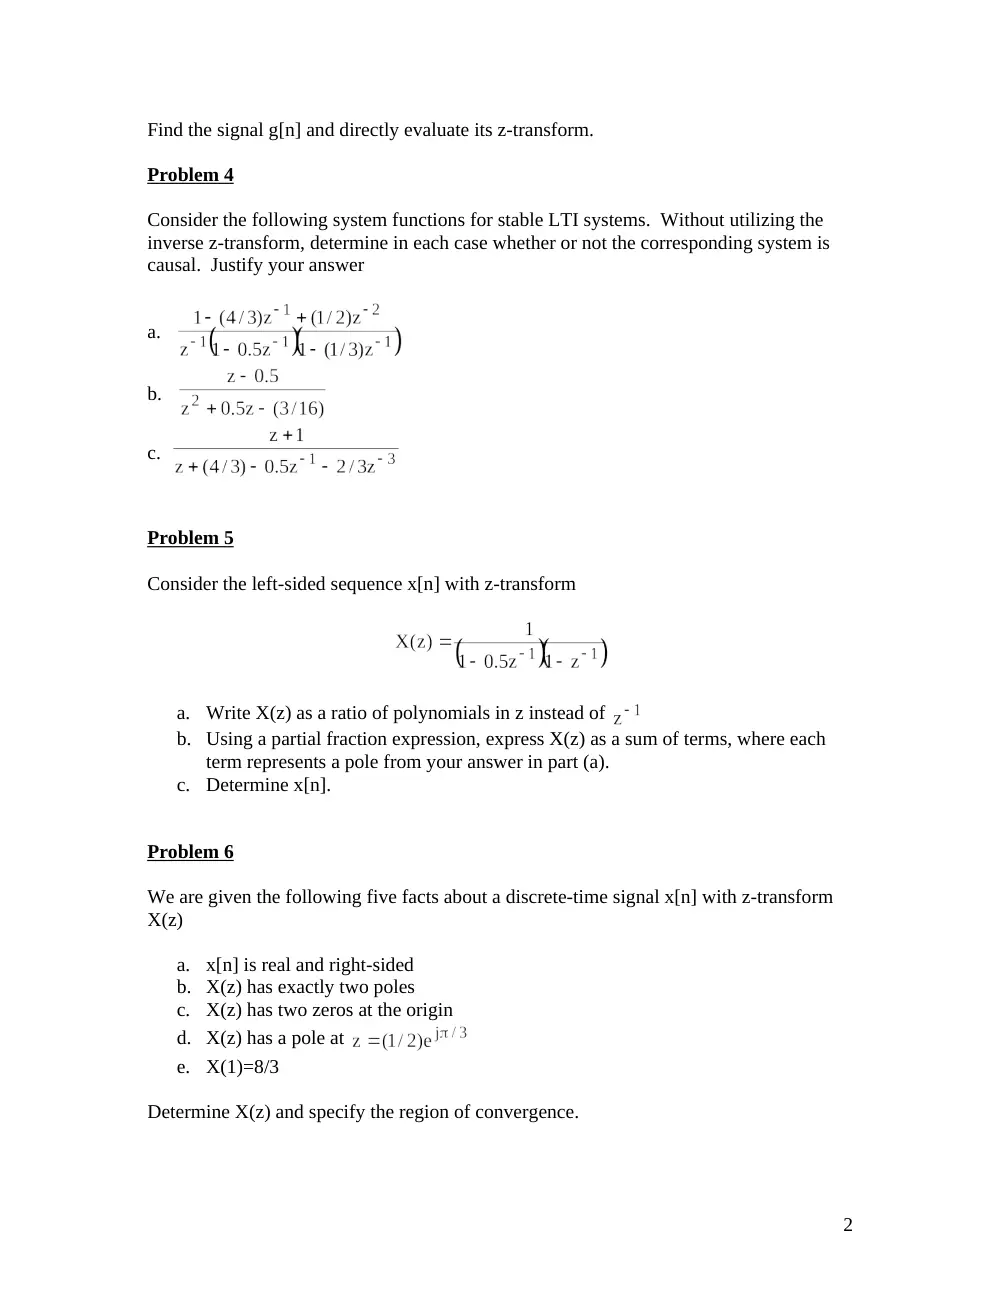
Find the signal g[n] and directly evaluate its z-transform.
Problem 4
Consider the following system functions for stable LTI systems. Without utilizing the
inverse z-transform, determine in each case whether or not the corresponding system is
causal. Justify your answer
a.
b.
c.
Problem 5
Consider the left-sided sequence x[n] with z-transform
a.
Write X(z) as a ratio of polynomials in z instead of
b. Using a partial fraction expression, express X(z) as a sum of terms, where each
term represents a pole from your answer in part (a).
c.
Determine x[n].
Problem 6
We are given the following five facts about a discrete-time signal x[n] with z-transform
X(z)
a.
x[n] is real and right-sided
b. X(z) has exactly two poles
c.
X(z) has two zeros at the origin
d. X(z) has a pole at
e.
X(1)=8/3
Determine X(z) and specify the region of convergence.
2
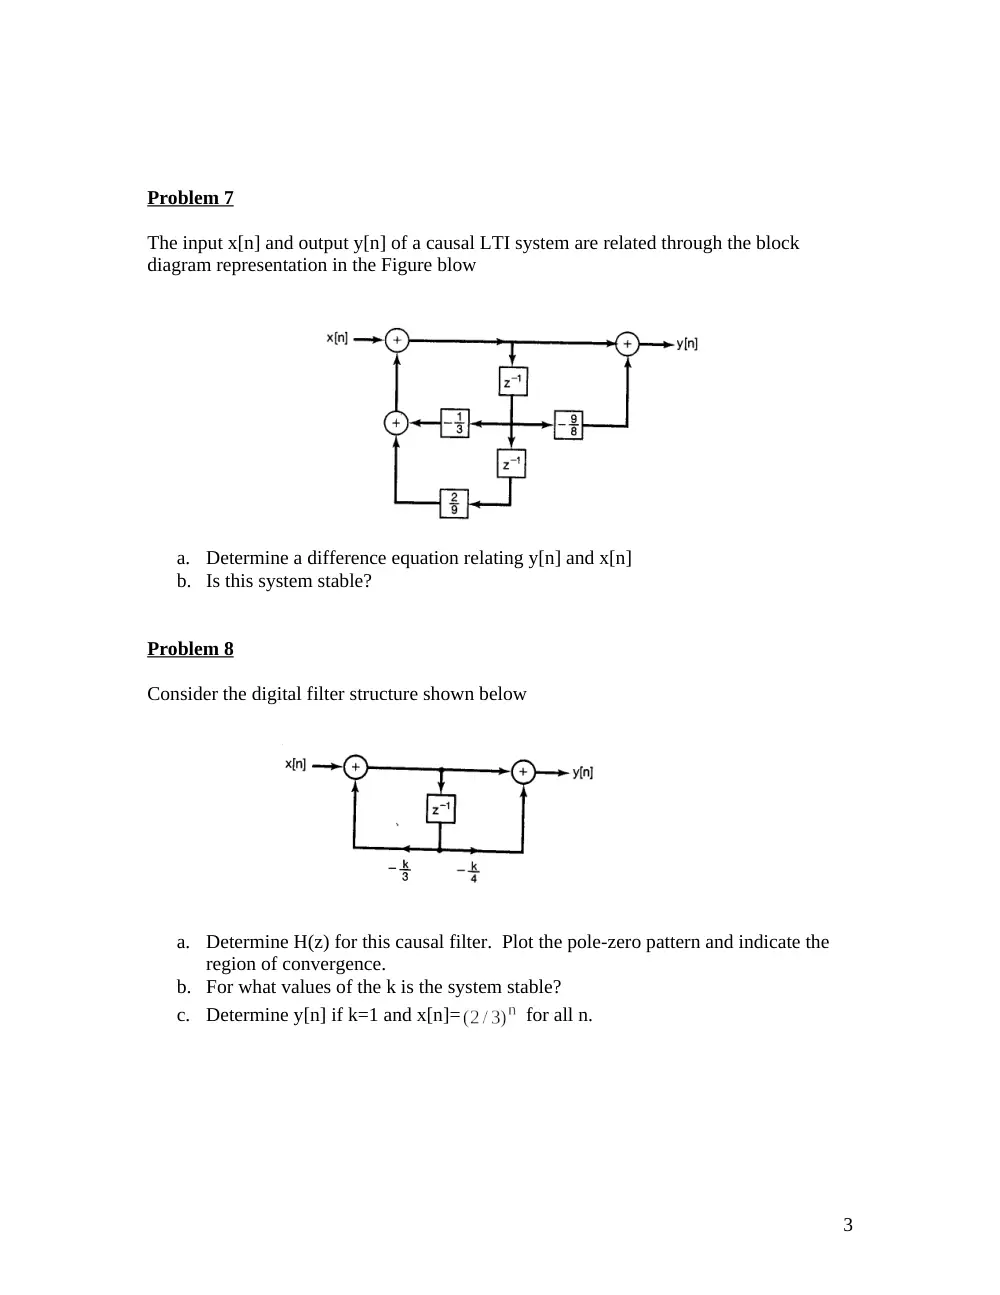
Problem 7
The input x[n] and output y[n] of a causal LTI system are related through the block
diagram representation in the Figure blow
a.
Determine a difference equation relating y[n] and x[n]
b. Is this system stable?
Problem 8
Consider the digital filter structure shown below
a.
Determine H(z) for this causal filter. Plot the pole-zero pattern and indicate the
region of convergence.
b. For what values of the k is the system stable?
c.
Determine y[n] if k=1 and x[n]=
for all n.
3
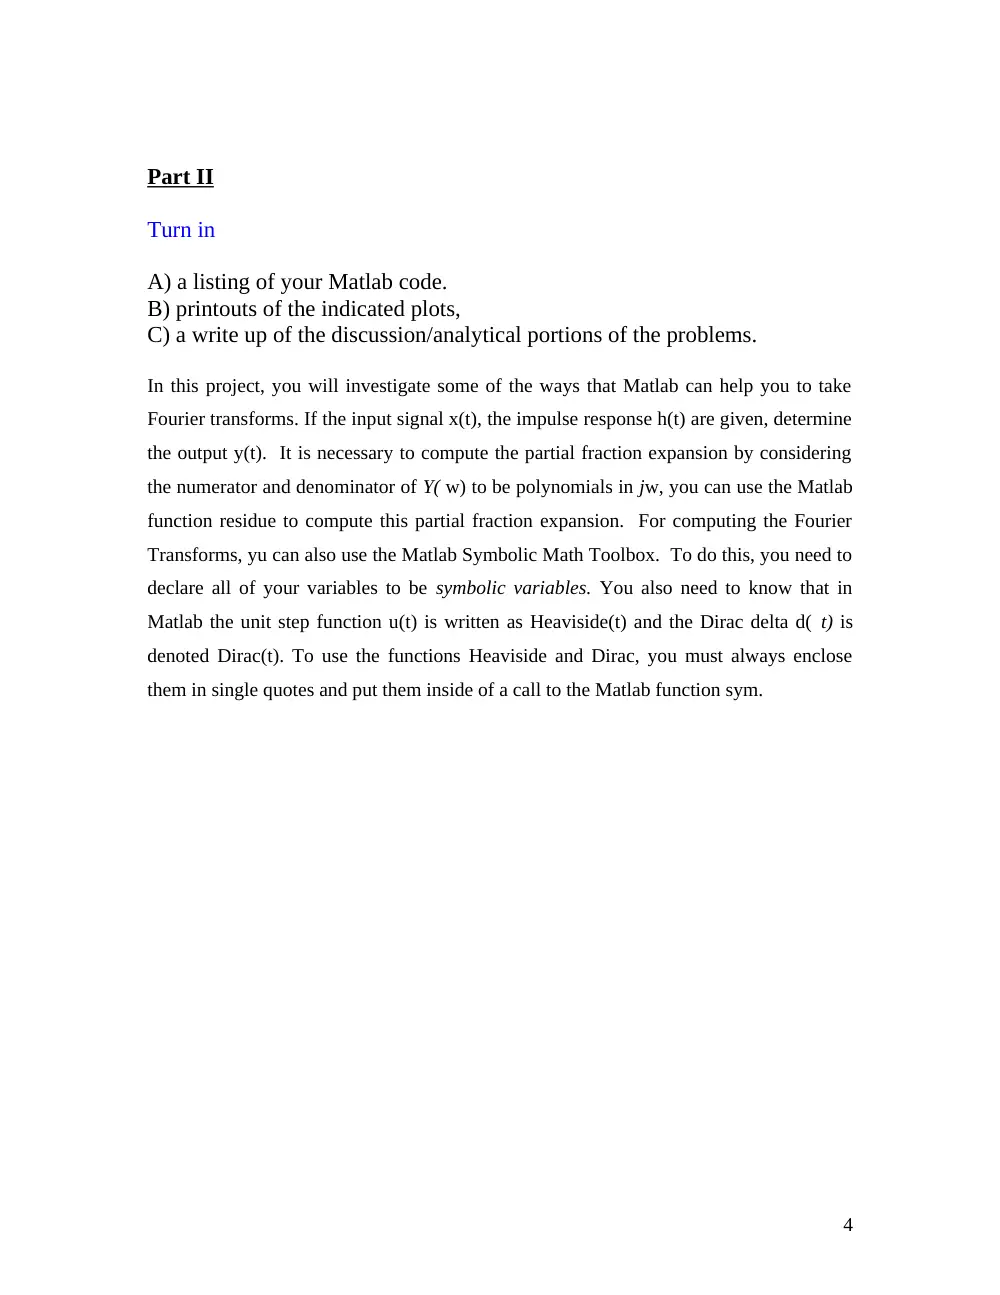
Part II
Turn in
A) a listing of your Matlab code.
B) printouts of the indicated plots,
C) a write up of the discussion/analytical portions of the problems.
In this project, you will investigate some of the ways that Matlab can help you to take
Fourier transforms. If the input signal x(t), the impulse response h(t) are given, determine
the output y(t). It is necessary to compute the partial fraction expansion by considering
the numerator and denominator of Y( w) to be polynomials in jw, you can use the Matlab
function residue to compute this partial fraction expansion. For computing the Fourier
Transforms, yu can also use the Matlab Symbolic Math Toolbox. To do this, you need to
declare all of your variables to be symbolic variables. You also need to know that in
Matlab the unit step function u(t) is written as Heaviside(t) and the Dirac delta d( t) is
denoted Dirac(t). To use the functions Heaviside and Dirac, you must always enclose
them in single quotes and put them inside of a call to the Matlab function sym.
4