
PHYS 101 Lab Report, Spring 2008
American University of Beirut · Introductory Physics I · 107 pages






Showing the first 10 of 107 pages. Download the PDF to see all of it.
More PHYS 101 files
Show the text of this lab
ROTATIONAL INERTIA
1. Object:
The purpose of this experiment is to measure the rotational inertia of a disk
and a ring experimentally and compare it with the theoretical value and to
experimentally test the parallel axis theorem.
2. Equipment:
Science workshop interface, PC, Smart pulley, rotational apparatus, mass set
and hanger, balance, caliper, string.
3. Theory:
The rotational inertia of a homogenous disk of radius R and mass M about an
axis perpendicular to its surface and passing through the center of the disk is given by:
(1)
The rotational inertia of a ring of mass M and radiuses R1 and R2 is given by:
(2)
To find the rotational inertia of the disk (or ring) experimentally, a known torque is
applied to the disk and the resulting angular acceleration is measured :
R1
R2
Ring of radiuses R1, R2 and mass M.
R
Disk of radius R and mass M.
Perpendicular rotational
axis
Parralel rotational axis
(3)
Where, is the angular acceleration in (rd/s2) and is the torque in (N.m).
(4)
By definition the torque is equal to:
(5)
Where r is the distance from the center of the ring to the point where the force is
applied. If and
are perpendicular, then:
(6)
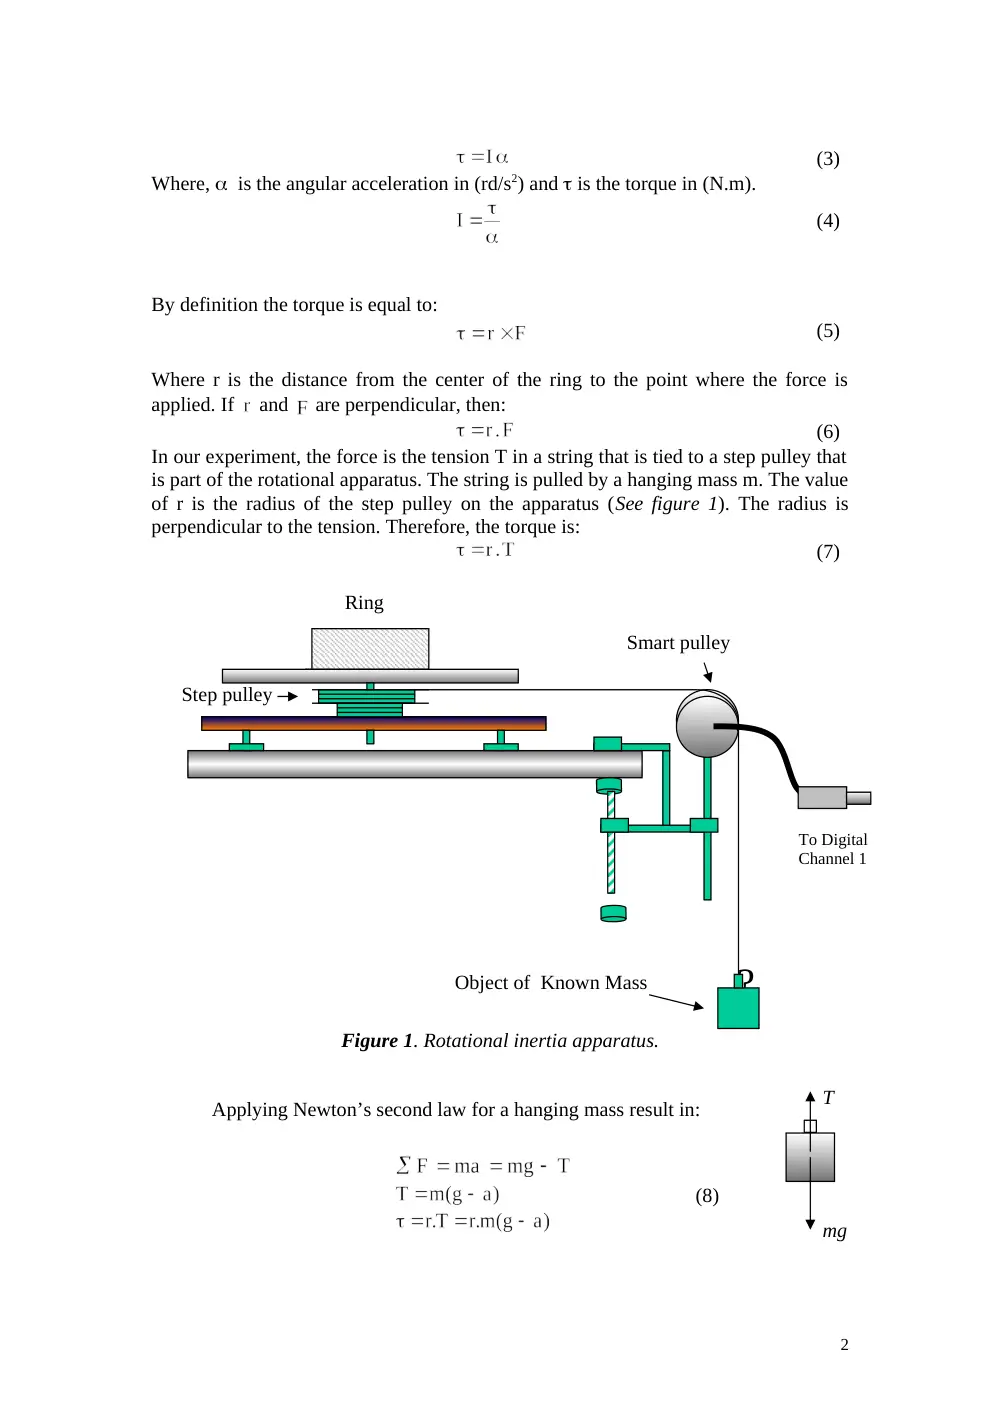
In our experiment, the force is the tension T in a string that is tied to a step pulley that
is part of the rotational apparatus. The string is pulled by a hanging mass m. The value
of r is the radius of the step pulley on the apparatus (See figure 1). The radius is
perpendicular to the tension. Therefore, the torque is:
(7)
Figure 1. Rotational inertia apparatus.
Applying Newton’s second law for a hanging mass result in:
(8)
2
mg
T
?
Ring
Step pulley
Smart pulley
Object of Known Mass
To Digital
Channel 1
Where a is the tangential acceleration of the rotating apparatus and m is the
hanging mass.
(9)
thus, Using Equations (3), (8) and (9) we obtain:
(10)
4. Procedure and Analysis:
For this activity, the smart pulley measures the motion of a hanging mass that
is connected by a string to a step pulley on the rotational apparatus. The Science
Workshop program calculates and displays velocity versus time, the slope of this
curve is the acceleration.
1. Set up the rotational accessory, first mount the disk only.
2. Connect the science workshop interface to the computer and turn it on.
3. Connect the stereo phone plug of the smart pulley to Digital Channel 1 on
the interface.
4. Open the file titled P26_ROTA.SWS, found in the hard disk c:/Phys105.
The document opens with a graph display of Velocity (m/s) versus time.
5. Measure the diameter of the smallest step pulley on the main plotter of the
rotational apparatus measure the radius of the disk.
6. Use a string that is about 10cm longer than the distance needed to reach
from the spindle of the rotational apparatus over the smart pulley and
down to the floor. Tie one end of the string to the edge of the smallest step
pulley of the rotational apparatus. Then put the string in the groove of
smart pulley adjust leveling.
7. Attach 500g to the string and wind the string around the step pulley of the
disk by rotating the disk until the mass hanger is raised almost to the smart
pulley. Hold the system in this position.
8. Click the REC bottom to begin recording data and then release the disk.
9. Click STOP bottom just before the mass hanger reaches the floor. Note
RUN#1 will appear in the DATA list in the experiment set up window.
10. Repeat steps 7 to 10 for the acceleration of the disk. RUN#2 will appear in
the DATA list in the experiment set up windows.
11. Record in both cases the value of slope by opening the statistic mode.
3
12. Determine the rotational inertia of the disk and compare it with the
theoretical value.
13.Add the ring on the top of the disk and repeat 7,8,9,10, 11. Deduce finally
the value of rotational inertia of the ring and compare it to the theoretical
value using Equation (2). Note that the rotational inertia of the system disk
plus ring is : Itotal = Idisk +Iring
14. Perform the same experiment using the disk, but this time change the
rotation axis to be passing through the plane of the disk.
4
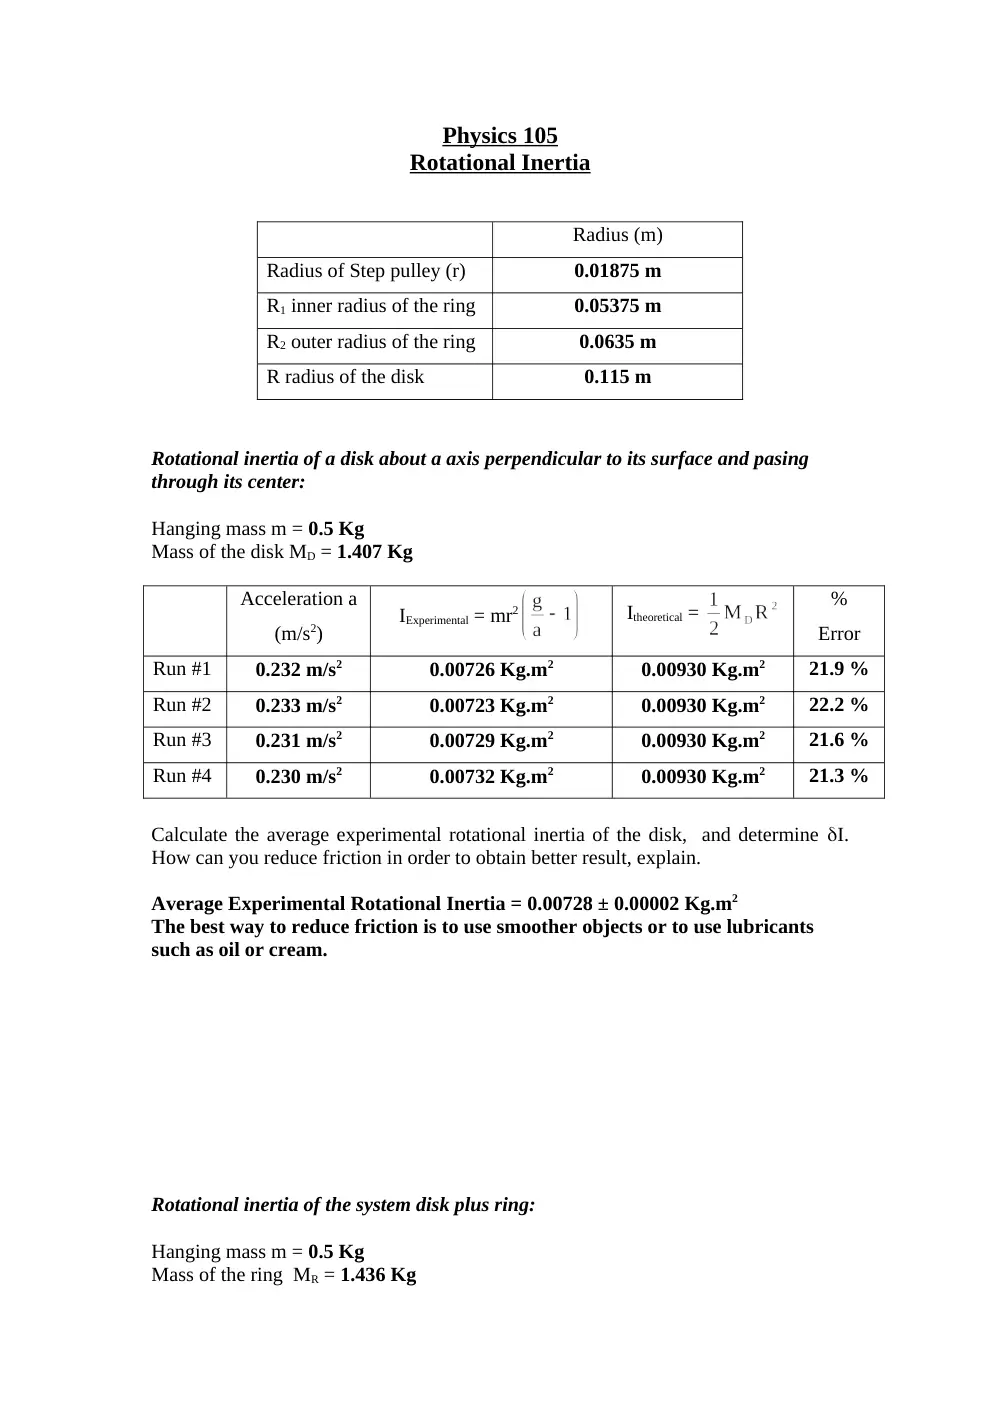
Physics 105
Rotational Inertia
Radius (m)
Radius of Step pulley (r)
0.01875 m
R1 inner radius of the ring
0.05375 m
R2 outer radius of the ring
0.0635 m
R radius of the disk
0.115 m
Rotational inertia of a disk about a axis perpendicular to its surface and pasing
through its center:
Hanging mass m = 0.5 Kg
Mass of the disk MD = 1.407 Kg
Acceleration a
(m/s2)
IExperimental = mr2
Itheoretical =
%
Error
Run #1
0.232 m/s2
0.00726 Kg.m2
0.00930 Kg.m2
21.9 %
Run #2
0.233 m/s2
0.00723 Kg.m2
0.00930 Kg.m2
22.2 %
Run #3
0.231 m/s2
0.00729 Kg.m2
0.00930 Kg.m2
21.6 %
Run #4
0.230 m/s2
0.00732 Kg.m2
0.00930 Kg.m2
21.3 %
Calculate the average experimental rotational inertia of the disk, and determine I.
How can you reduce friction in order to obtain better result, explain.
Average Experimental Rotational Inertia = 0.00728 ± 0.00002 Kg.m2
The best way to reduce friction is to use smoother objects or to use lubricants
such as oil or cream.
Rotational inertia of the system disk plus ring:
Hanging mass m = 0.5 Kg
Mass of the ring MR = 1.436 Kg
Run
Acceleration
(m/s2)
IExperimental = mr2
Itheoretical =
%
Error
#1
0.152 m/s2
0.0112 Kg.m2
0.0143 Kg.m2
21.7 %
#2
0.151 m/s2
0.0112 Kg.m2
0.0143 Kg.m2
21.7 %
#3
0.153 m/s2
0.0111 Kg.m2
0.0143 Kg.m2
22.4 %
#4
0.152 m/s2
0.0112 Kg.m2
0.0143 Kg.m2
21.7 %
Deduce the experimental rotational inertia of the ring and compare it with the
theoretical value. Comment.
Theoretical Rotational Inertia = 0.00497 Kg.m2
Experimental Rotational Inertia = 0.00392 Kg.m2
Error = 21.1 %
Our values are very precise but the accuracy isn’t that great, but acceptable.
Rotational inertia of a disk about a axis passing along its surface:
Hanging mass m = 0.5 Kg
Mass of the disk MD = 1.407 Kg
Acceleration a
(m/s2)
IExperimental = mr2
Itheoretical =
%
Error
Run #1
0.416 m/s2
0.00397 Kg.m2
0.00465 Kg.m2
17.1 %
Run #2
0.415 m/s2
0.00398 Kg.m2
0.00465 Kg.m2
17.1 %
Run #3
0.415 m/s2
0.00398 Kg.m2
0.00465 Kg.m2
17.1 %
Run #4
0.414 m/s2
0.00399 Kg.m2
0.00465 Kg.m2
17.0 %
Calculate the average experimental rotational inertia of the disk, and determine I.
How can you reduce friction in order to obtain better result, explain.
Average Experimental Rotational Inertia = 0.003980 ± 0.000004 Kg.m2
Same as before you should use smoother objects and lubricants to reduce friction
as much as possible.
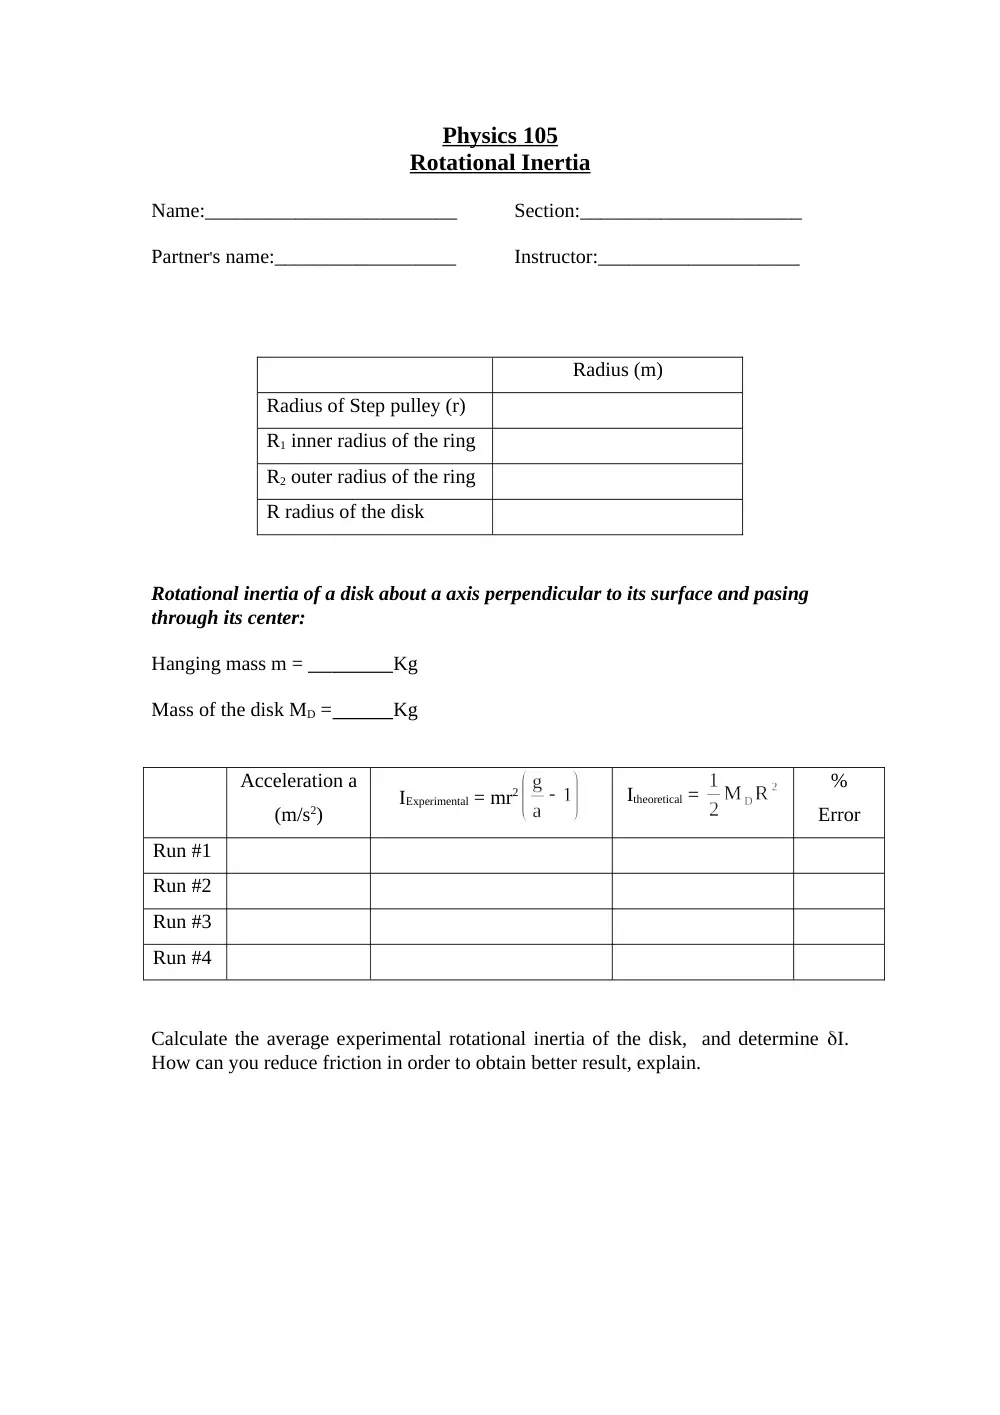
Physics 105
Rotational Inertia
Name:_________________________
Section:______________________
Partner's name:__________________
Instructor:____________________
Radius (m)
Radius of Step pulley (r)
R1 inner radius of the ring
R2 outer radius of the ring
R radius of the disk
Rotational inertia of a disk about a axis perpendicular to its surface and pasing
through its center:
Hanging mass m =
Kg
Mass of the disk MD =
Kg
Acceleration a
(m/s2)
IExperimental = mr2
Itheoretical =
%
Error
Run #1
Run #2
Run #3
Run #4
Calculate the average experimental rotational inertia of the disk, and determine I.
How can you reduce friction in order to obtain better result, explain.
Rotational inertia of the system disk plus ring:
Hanging mass m = ____
Kg
Mass of the ring MR =
Kg
Run
Acceleration
(m/s2)
IExperimental = mr2
Itheoretical =
%
Error
#1
#2
#3
#4
Deduce the experimental rotational inertia of the ring and compare it with the
theoretical value. Comment.
Rotational inertia of a disk about a axis passing along its surface:
Hanging mass m =
Kg
Mass of the disk MD =
Kg
Acceleration a
(m/s2)
IExperimental = mr2
Itheoretical =
%
Error
Run #1
Run #2
Run #3
Run #4
Calculate the average experimental rotational inertia of the disk, and determine I.
How can you reduce friction in order to obtain better result, explain.
CONSERVATION OF MECHANICAL ENERGY
1. Object:
The purpose of this experiment is to test the conservation of energy of a system by
using a falling object and rotational system.
2. Equipment: Science workshop interface, Smart pulley, Balance, Masses and hangers set,
Meter stick, Rotational apparatus, PC, and Vernier caliper.
3. Theory:
The gravitational potential energy of an object of mass m and a distance h from the
floor is given by:
PE = mgh
(1)
where g is the acceleration due to gravity. The Kinetic energy of a rotating object
depends on its rotational inertia I and its angular speed ω. The rotational kinetic energy is
given by:
(2)
A falling object has also translational Kinetic energy given by:
KET =
(3)
Where m is the mass of the falling object and v its velocity.
Conservation of Mechanical Energy between the
initial and final position gives:
mgh =
(4)
Main plotter
Step pulley
Smart pulley
h
Initial
position (h1)
Final position
(h2)
4. Procedure:
For this activity, the rotational inertia of the main plotter of the rotational apparatus
should first be calculated. We will use the same method as in the previous experiment where
the smart pulley measures the motion of the plotter as it is accelerated by a net torque.
The science workshop program calculate and displays the speed of the system versus
time, and the tangential acceleration could be determined from the slope. To find the
rotational inertia of the main plotter, a known torque is applied to the main plotter and the
resulting motion is measured. From the previous experiment we know that:
(4)
Make necessary measurements and determine the rotational inertia of the main plotter Iplotter.
After finding Iplotter hang a mass attached to the step pulley on the main plotter using a
string and allow the mass to fell. The smart pulley measures the motion of the main plotter
and that of falling object. The science workshop program calculate and displays the speed V
of the falling mass also used to calculate the angular speed of rotating plotter and change in
rotational kinetic energy.
1- Connect science workshop interface.
2- Connect the smart pulley’s stereoplane plug into digital channel 1 of the interface.
Open file titled P29_GRAV.SWS, found in the hard drive directory C:/PHYS105, The
document will open with a graph display and a table display of velocity. The velocity
isufy tells you how fast the falling object is dropping. The velocity will be used to
determine angular speed of plotter and the object translational K.E.
3- Put the rotational apparatus box near the edge of the table and place main plotter on
the spindle.
4- Mount the smart pulley’s rod vertically in the table clamp.
5- Use a piece of string about 50 cm longer than the distance from the top of the smart
pulley to the floor. Put one end of the string through the hole in the edge of the
smallest step pulley on the main plotter and thread the string upward through the hole.
Then tie the string around the round head screw on the step pulley.
6- Attach mass hanger to other end of the string. (Use 200 g).
7- Wind the string around the plotter’s step pulley by rotating the plotter until the mass
hanger is raised almost to the smart pulley. Hold the plotter.
8- Click REC button to high recording data and release the plotter. Click the STOP
button just before the falling mass reach floor.
9- Run#1 will appear. Measure the diameter of the step pulley using caliper.
10- Adjust the position of the mass hanger on the string. Attach the hanger so it is high
enough on the string that it will not hit the floor at its lowest position. Measure h2 and
h1.
11- Click REC and release the plotter allow the mass to reach lower position and then
click stop. Repeat several time keeping h1 constant using different mass:100, 150,
200g.
12- Click experiment menu in the menu bar and select RUN#1 data and graph now can be
displayed.
13- The maximum speed corresponds to the point whose gravitational potential energy of
the falling object reached a minimum and rotational kinetic energy of the plotter
reached maximum.
14- Calculate the rotational kinetic energy of the main plotter. Remember that =v/r
where r is the radius of step pulley.
15- Record the maximum linear speed V and maximum rotational kinetic energy for
RUN#1.
16- Repeat analysis for all data run by selecting each run from the experiment menu, and
fill in the data sheet. Calculate total K.E, the sum of maximum rotational K.E and
maximum linear kinetic energy. Calculate PE of falling object.
17- Make percent error and comment on conservation of energy.
Physics 101L
CONSERVATION OF MECHANICAL ENERGY
Rotational inertia of the main plotter:
Hanging mass m = 0.200 Kg
Mass of the main plotter Mplotter = 1.410 Kg
Radius of Step pulley (r) = 0.01855 m
Acceleration a (m/s2)
IPlotter = mr2
Run #1
0.076 m/s2
0.0088 Kg.m2
Run #2
0.080 m/s2
0.0084 Kg.m2
Run #3
0.078 m/s2
0.0086 Kg.m2
Run #4
0.077 m/s2
0.0087 Kg.m2
What is the average value of the main plotter’s rotational inertia?
I average = 0.0086 ± 0.0001 Kg.m2
Conservation of Mechanical Energy:
Run
Mass
m (Kg)
h
=h2-h1
Vmax
(m/s)
(J)
Total K.E.
(J)
mgh
(J)
% diff.
1
0.300
Kg
0.9375
m
0.449
m/s
2.52 J
0.020 J
2.54 J
2.76 J
7.97 %
2
0.250
Kg
0.9375
m
0.411
m/s
2.12 J
0.017 J
2.14 J
2.30 J
6.96 %
3
0.200
Kg
0.9375
m
0.369
m/s
1.70 J
0.014 J
1.71 J
1.84 J
7.07 %
4
0.150
Kg
0.9375
m
0.320
m/s
1.29 J
0.010 J
1.30 J
1.38 J
5.80 %
5
0.100
Kg
0.9375
m
0.258
m/s
0.831 J
0.0067
J
0.838 J
0.92 J
8.9 %
6
0.050
Kg
0.9375
m
0.179
m/s
0.400 J
0.0032
J
0.403 J
0.46 J
12 %
1. Is the rotational Kinetic energy equal to the gravitational potential energy of the falling
object?
No they are not equal, since there are other factors that contribute to the overall
Mechanical Energy.
2. How does the total kinetic energy compare to the gravitational potential energy of the
falling object?
They have to be equal.
Physics 101L
CONSERVATION OF MECHANICAL ENERGY
Rotational inertia of the main plotter:
Hanging mass m =
Kg
Mass of the main plotter Mplotter =
Kg
Radius of Step pulley (r) =_______________ m
Acceleration a (m/s2)
IPlotter = mr2
Run #1
Run #2
Run #3
Run #4
What is the average value of the main plotter’s rotational inertia?
I average = ______________________________.
Conservation of Mechanical Energy:
Run
Mass
m (Kg)
h
=h2-h1
Vmax
(m/s)
(J)
Total K.E.
(J)
mgh
(J)
% diff.
1
2
3
4
5
6
1. Is the rotational Kinetic energy equal to the gravitational potential energy of the falling
object?
2. How does the total kinetic energy compare to the gravitational potential energy of the
falling object?
XI. Simple Harmonic motion
1. Object:
To study the simple Harmonic motion of an oscillating spring and a torsional
pendulum.
2. Apparatus:
Spring, masses, torsion wire, Wheel with ball bearing, metal disk, metal
ring, meter-stick, and stopwatch.
3. Experiment:
When metals are subjected to a external stress, that is not too large so that
the body is deformed completely, the deformation or strain is generally proportional to
the stress. The metal body, in its attempt to return to its original shape exerts a restoring
stress. Systems where restoring stress is proportional to the strain are said to obey
Hooke’s law.
A. Oscillating spring: When a mass m is hung from a massless spring, the gravitational force
(stress) stretches the spring (strain) from its unloaded length L0 to a new length L1. If the
spring obeys Hooke’s law then,
F = - k(L1-L0) = -mg
(1)
Where F is the restoring force that is equal and opposite to the gravitational force mg,
when the system is in equilibrium, and k is the spring constant in N/m.
If the spring is stretched further and released, then at any length L the spring exerts a
force –k(L -L0) on the mass and the net force on m is:
F = -k (L-L1) = -kx
(2)
Where x represents the displacement of the mass from its equilibrium position at a spring
length L1.
The Equation of motion of m subject to this force is:
(3)
Equation (3) predicts that m will undergo simple harmonique motion according to:
x = A sin(t +)
(4)
where A is the amplitude of the motion and w is the angular frequency. The period of the
motion T is given by:
(5)
and is independent of the amplitude.
B. Torsional pendulum: When a torque (stress) is applied to the torsion wire is twisted through
an angle (strain). In its attempt to return to its undistorted condition the wire exerts a restoring
torque that is proportional to the angular displacement from equilibrium . If the wire obey
Hooke’s law, then
= -C
(6)
where C is the torsional constant of the wire in N.m/rad. If a rigid body is attached to this wire
and the wire is twisted and released, the body undergoes simple harmonic rotational motion. The
motion is purely rotational about a fixed axis, namely the wire, and the equation of motion of the
body is:
(7)
where I is the rotational momentum of inertia of the body about the axis of rotation. The period
of the motion that is again independent of the amplitude is given by:
(8)
4. Procedures:
A. Oscillating spring:
1. Hang different masses (up to 1000 g) on the spring and measure (L1 – L0). Plot a graph of mg
against (L1 – L0) and find k using Eq. (1). Comment.
2. Hang masses (up to 1000 g in steps of 200 g) on the spring and set them into oscillation.
Measure the period T by timing a few oscillations using the stopwatch. Plot T2 versus m.
3. Find k from the slope of the second graph and compare with the value obtained in part 1.
4. If the mass of the spring ms is not negligible then the Equation of motion is modified and Eq.
(5) becomes (without proof):
(9)
the system behaves as if a larger effective mass (m + ms/3) is attached to a massless spring.
When ms << m Eq. (5) can be used safely. From the intercepts of the second graph evaluate ms.
Measure ms and compare.
B. Torsional pendulum:
1. Mount the wire on the hub of the wheel and clamp the other end. Using a set of weights, apply
torques to the wire and measure the angular displacement . Plot versus and find C.
2. Mount the metal disk on the wire and hang it vertically using the provided clamps. Twist the
wire and release it. Measure the period of the resulting motion.
3. Measure the mass and radius of the disk and find its moment of inertia. Calculate T using
Equation (8). Compare with part 2.
4. Add the metal ring to the disk and repeat steps 2 and 3. Comment.
PHYSICS 105
Exp. XI Simple Harmonique Motion
Object:
To study the simple Harmonic motion of an oscillating spring and a torsion pendulum
A. Oscillating spring
masses
200g
400
500
800
1000
L = L - Lo
0.200 m
0.405 m
0.513 m
0.837 m
1.033 m
t(10 oscillation)
10.47 s
13.99 s
15.44 s
19.04 s
21.35 s
T
1.047 s
1.399 s
1.544 s
1.904 s
2.135 s
I. Plot mg against L - Lo and find k.
K= 9.35
Comment: The graph of these two quantities is a straight line suggesting that they
are directly proportional.
II. Plot T2 against m and find k from the slope of the graph. Compare with the
previous value.
K= 9.19 This value is equal to the other K but there is a difference since
there is an experimental error which we expect.
Evaluate the mass ms of the spring from the graph and compare with the measured
value.
ms= 0.163 Kg
B. Torsional pendulum
a) Determination of C
mass (Kg)
0.200 Kg
0.400 Kg
0.500 Kg
0.800 Kg
1.00 Kg
0.14
0.28
0.35
0.56
0.70
(degrees)
5.5
10
12.5
19
24
Plot vs. and find C
C= 0.0304
b) metal disk hung vertically measure the period T1= 1.155 s
for r twisting angles T2= 1.172 s
mass of disk M= 6.500 Kg
radius of disk R= 0.142 m
rotational inertial I= 0.0655 Kg.m2
Calculate T and compare with the previous experimental value.
T= 9.213 s It should be equal with the experimental T but it isn’t and I
am not sure why.
c) Repeat the previous experiment after adding the metal ring.
T1= 1.408 s
T2= 1.424 s
M of Disk= 6.500 Kg
M of ring= 1.985 Kg
R1= 0.121 m
R2= 0.127 m
I= 0.0961 Kg.m2
T= 11.2s Since C is a constant that doesn’t change, then the Rotational Inertia is
the factor that can change the period. Now the Inertia is increasing in
experiment (c). So the Period also increases since they are
directly proportional. Also in this case the period should also be equal
to the experimental value but it isn’t and I am not sure why.
PHYSICS 105
Exp. XI Simple Harmonique Motion
NAME: ____________________________ SECTION: ________
P_NAME: __________________________ INSTRUCTOR: __________
Object:
A. Oscillating spring
masses
200g
400
500
800
1000
L = L - Lo
t(10 oscillation)
T
I. Plot mg against L - Lo and find k.
Comment.
II. Plot T2 against m and find k from the slope of the graph. Compare with the
previous value.
Evaluate the mass ms of the spring from the graph and compare with the measured
value.
B. Torsional pendulum
a) Determination of C
mass
Plot vs and find C
b) metal disk hung vertically measure the period T1 = . . . . . . . . . . . . . . . . .
for r twisting angles T2 = . . . . . . . . . . . . . . . . .
mass of disk M = . . . . . . . . . . . . . . . . .
radius of disk R = . . . . . . . . . . . . . . . . .
rotational inertial I = . . . . . . . . . . . . . . . . .
Calculate T and compare with the previous experimental value.
c) Repeat the previous experiment after adding the metal ring.
Comment.
Physics 101 L
Exp. 1 Measurement
A. Time Measurement
1. Stop watch
Group
1
2
3
4
5
6
X
Beats/s
87
76
80
81
77
1.4
0.080
0.036
1.5
1.3
1.3
1.4
1.3
2. Vibrator
: Calibration of the tick.
Length of tape L = 2.00 meters
Number of dots N = 176 dots
Measured Time T = 5.0 seconds
One tick = 0.028 seconds
3. Stroboscope
The frequency (RPM): 1500 RPM
The frequency (RPS): 25 Hz
The time for 1 tick: 0.040 seconds
Find the percentage error: 43% error
B. Length Measurements
:
1. Meter stick
Area (A) = Length (L) width ( W)
L=2.0220 0.0005 ; W = 0.6100 0.0005 ; A =1.233 m2 ; A +0.001
A = (1.233 0.001) m2
2. Vernier Calipers
Inner radius
Outer radius
1
0.62 cm
0.73 cm
2
0.54 cm
0.66 cm
3
0.39 cm
0.48 cm
Micrometer calipers
Wire 1
Wire 2
Wire 3
0.83 mm
0.89 mm
1.00 mm
C. Mass and Density Measurement
:
1. Steel balls
You will be given 3 different steel balls.
Mass (g)
Diameter (d)
(d3)
1
27.7 0.05 g
1.89 0.01 cm
6.75 0.11 cm3
2
7.99 0.05 g
1.28 0.01 cm
2.10 0.05 cm3
3
5.40 0.05 g
1.09 0.01 cm
1.30 0.04 cm3
Using the table , plot the (mass) versus (d3) . Calculate the slope. Determine the density ()
from the slope. Find .
Express as : = (7.91 1.2) g/cm3
Physics 101 L
Exp. 1 Measurement
NAMES: ____________________________ I.D#: ______________
____________________________ _______________
Section: __________________________ Date: ______________
A. Time Measurement
1. Stop watch
Group
1
2
3
4
5
6
X
Beats/s
2. Vibrator
: Calibration of the tick.
Length of tape L =
Number of dots N =
Measured Time T =
One tick =
3. Stroboscope
The frequency (RPM):
The frequency (RPS):
The time for 1 tick:
Find the percentage error:
B. Length Measurements
:
1. Meter stick
Area (A) = Length (L) width ( W)
L= ; W = ; A = ; A +
A = ( )
2. Vernier Calipers
Inner radius
Outer radius
1
2
3
3. Micrometer calipers
Wire 1
Wire 2
Wire 3
C. Mass and Density Measurement
:
1. Steel balls
You will be given 3 different steel balls.
Mass (g)
Diameter (d)
(d3)
1
2
3
Using the table , plot the (mass) versus (d3) . Calculate the slope. Determine the density ()
from the slope. Find .
Express as : = ( ).
I. MEASUREMENT
1. Object: To familiarize the student with some basic measuring instruments.
2. Apparatus: Stopwatch, Timer-vibrator, paper tape, stroboscope, meter stick,
vernier calipers and micrometer calipers.
3. Experiment:
A. Time measurements:
Stopwatch. Use the stopwatch to measure your heart rate. Record the value on the
black board, and when the rates of all students are recorded calculate the mean rate,
the average deviation and standard deviation.
Vibrator. Anything that performs steady oscillatory motion can be used as a clock.
The time for one oscillation is a natural unit for making measurements. We shall call
this unit a “tick”. If one wants to know how long is this natural unit of time is
compared to a second then “Calibration has to be performed using a absolute standard
such as a stop watch.
To calibrate the vibrator we must find how much time it takes for one
oscillation. Since this time is short we must measure the time for many vibrations.
The vibrator is built as to print a dot on a paper tape every vibration. Your instructor
will show you how. Cut a piece of tape approximately one to two meters long and
pass it under the carbon paper. Start the vibrator and pull the tape at a uniform rate for
about 5 seconds. The time of movement of the tape should be measured with the
stopwatch.
Count the number of dot, which is the number of oscillations and calculate the
length of your “tick” in seconds. Repeat several times.
Stroboscope. Your instructor will use a stroboscope to measure the time for an
oscillation of your vibrator.
B. Distance measurements:
Meter stick. Use the meter stick to measure the length of your table. Calculate the
area and estimates the uncertainties.
Verniers Calipers. Use the verniers calipers to measure the inner and outer diameters
of the provided tubes. The instructor will help you.
Micrometer calipers. Use the micrometer calipers to measure the diameters of the
provided wires.
C. Mass and density:
The density of a substance is defined as:
(1)
where m is the mass of the object and V its volume. The instructor will show you how
to use the balance to determine the mass of the object.
Steel balls:
The volume of a sphere is given by,
(2)
where d is the diameter of the sphere and,
(3)
Measure the mass and diameters of three steel balls. Plot m against d3. The resulting
graph is a straight line. Calculate from the slope of this line.
II. POSITION, SPEED AND ACCELERATION
1. Object: The purpose of this activity is to introduce the relationships between the
motion of an object and a graph of position, velocity and time and to determine the
acceleration due to gravity by measuring the time of fall of a “picket fence” dropped
through a photogate.
2. Apparatus: Motion sensor, base and support rod, computer, PASCO Science
workshop interface, photogate or smart pulley, picket fence, spring-loaded clothes
pin, ruler.
3. Experiment:
When describing the motion of an object, knowing where it is relative to a
reference point, how fast and in what direction it is moving, and how it is accelerating
is essential. In this experiment a sonar ranging device “PASCO motion sensor” uses
pulses of ultrasound that reflect from object to determine the position of the object. As
the object moves, the change in its position is measured many times in each second.
The change in position from moment to moment is expressed as a velocity (meters per
second). The change in velocity from moment to moment is expressed as acceleration
(meters per second per second). The position of an object at a particular time can be
plotted on a graph, (a graph is a mathematical picture of the motion of an object). For
this reason it is important to understand how to interpret a graph of position, velocity,
or acceleration versus time.
A) Position versus time:
For this activity, you will be the object in motion. The motion sensor will
measure your position and your velocity as you move in a straight line. The challenge
in this activity is to move in such a way that a plot of your motion on the same graph
will much the line that is already there.
B) Velocity versus time:
As in part A), you will be the object in motion. The motion sensor will
measure your velocity as you move in a straight line at different speeds. The science
Workshop program plots your motion on a graph of velocity and time. The challenge
in this activity is to move in such a way that a plot of your motion on the same graph
will match the line that is already there.
C) Acceleration due to gravity:
Under the effect of gravitational attraction, falling bodies move with a constant
acceleration of approximately 9.8 m.s-2 near sea level. To study the motion of a falling
object, and thus be able to determine its velocity and acceleration we have to make a
record of its position at different times. If air resistance is neglected, and speed of the
object is measured over several short consecutive intervals of time as it falls, the
difference in the speed can be used to determine the acceleration due to gravity.
In this activity, a “picket fence” (a clear plastic strip with uniformly spaced
opaque bands) drops through a photogate (Fig. 1). The photogate beam is blocked by
each opaque band and the time from one blockage to the next becomes increasingly
shorter. Knowing the distance between the leading edge of each opaque band, the
science workshop program calculates the average speed of the picket fence from one
band to the next. The slope of the graph of average speed versus time gives the
acceleration of the falling object.
Fig. 1
To Interface
Photogate
Base & Support rod
Picket fence
4. Procedure:
A) Position versus time.
1. Connect the science workshop interface to the computer, turn on the interface and
turn on the computer.
2. Connect the motion sensor’s phone plugs to digital channels 1 and 2 on the
interface. (The yellow taped plug to digital channel 1).
3. Open the file titled P01_MOT1.SWS located in the directory c:\phys105.
4. Set up the sampling option of your experiment as follow:
a) Periodic samples = fast 10 Hz
b) Condition = time at 10 seconds e. g. after 10 seconds the program will stop
collecting data.
5. Mount the motion on a support road so that it is aimed at your midsection when
you are setting in front of the sensor. Make sure that you can move at least two
meters away from the motion sensor. Position the computer monitor so you can
see the screen while you are moving away from the sensor.
6. From the existing graph on your screen determine the following:
a) How close should you be to the motion sensor at the beginning?
b) How far away should you move?
c) How long your motion last?
7. Click REC button to begin recording data. (Data recording will begin almost
immediately. The motion sensor will make a faint clicking noise.
8. Watch the plot of your motion on the gr