
PHYS 210 Lab Reports Solved, Fall 2006
American University of Beirut · Introductory Physics II · 32 pages · with solution

Showing the first 10 of 32 pages. Download the PDF to see all of it.
More PHYS 210 files
- Syllabus · Spring 2019LabView
- Lab Report · Fall 2015LabView
- Lecture · Spring 2008LabView
- Final Collection Finals with Solution · Spring 2017Final exam · with solutionView
- Final 2015 · Spring 2017Final examView
- Questions TEST BANK · Fall 2015ProblemsView
- Problems Chapter 5 · Fall 2015ChapterView
- Problems Chapter 6 · Fall 2015ChapterView
Show the text of this lab
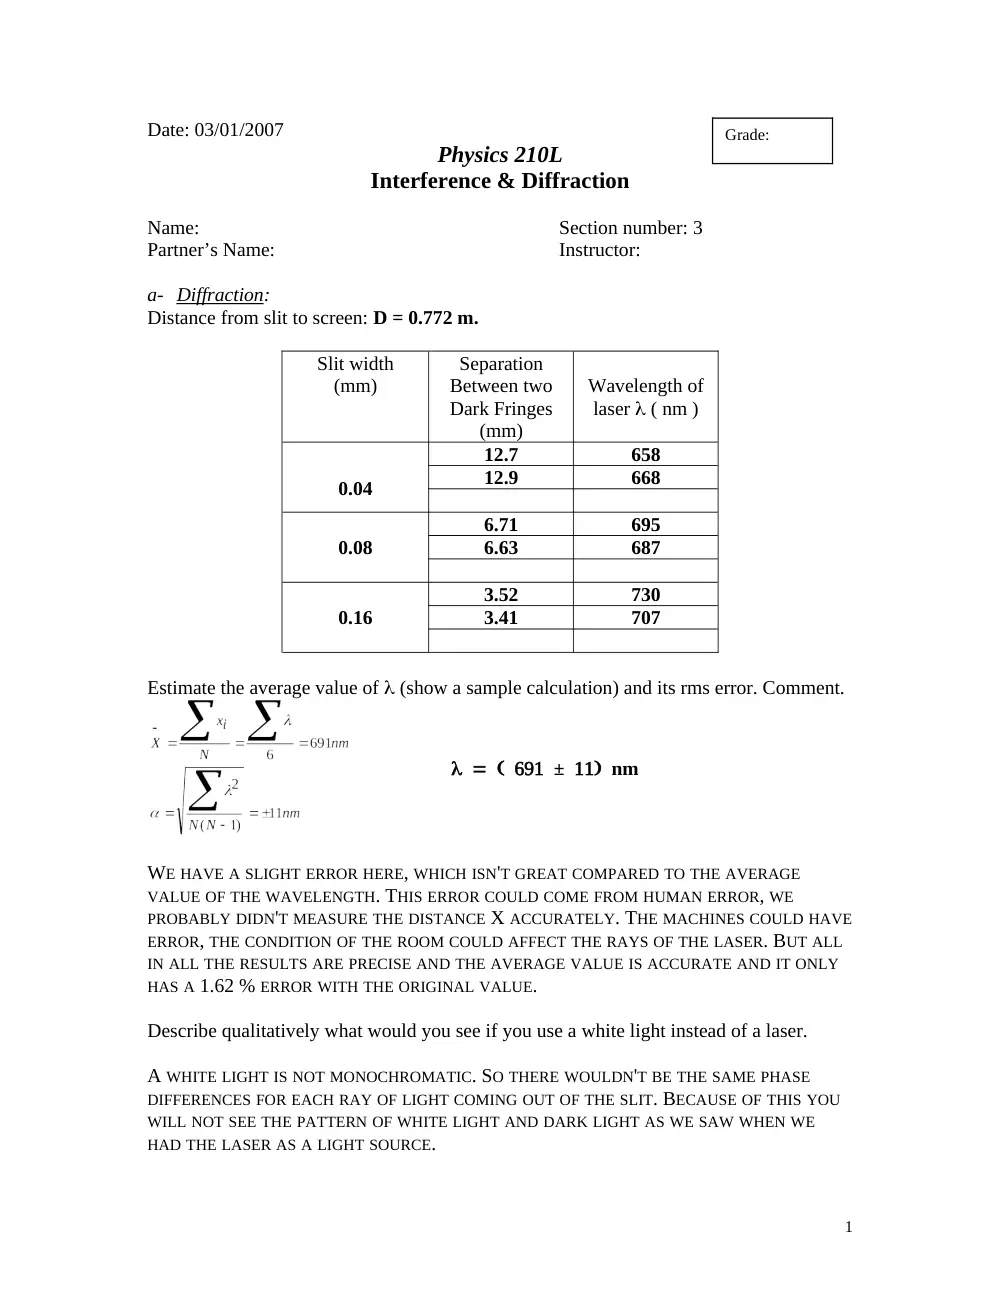
Date: 03/01/2007
Physics 210L
Interference & Diffraction
Name:
Section number: 3
Partner’s Name:
Instructor:
a- Diffraction
:
Distance from slit to screen: D = 0.772 m.
Slit width
(mm)
Separation
Between two
Dark Fringes
(mm)
Wavelength of
laser ( nm )
0.04
12.7
658
12.9
668
0.08
6.71
695
6.63
687
0.16
3.52
730
3.41
707
Estimate the average value of (show a sample calculation) and its rms error. Comment.
±nm
WE HAVE A SLIGHT ERROR HERE, WHICH ISN'T GREAT COMPARED TO THE AVERAGE
VALUE OF THE WAVELENGTH. THIS ERROR COULD COME FROM HUMAN ERROR, WE
PROBABLY DIDN'T MEASURE THE DISTANCE X ACCURATELY. THE MACHINES COULD HAVE
ERROR, THE CONDITION OF THE ROOM COULD AFFECT THE RAYS OF THE LASER. BUT ALL
IN ALL THE RESULTS ARE PRECISE AND THE AVERAGE VALUE IS ACCURATE AND IT ONLY
HAS A 1.62 % ERROR WITH THE ORIGINAL VALUE.
Describe qualitatively what would you see if you use a white light instead of a laser.
A WHITE LIGHT IS NOT MONOCHROMATIC. SO THERE WOULDN'T BE THE SAME PHASE
DIFFERENCES FOR EACH RAY OF LIGHT COMING OUT OF THE SLIT. BECAUSE OF THIS YOU
WILL NOT SEE THE PATTERN OF WHITE LIGHT AND DARK LIGHT AS WE SAW WHEN WE
HAD THE LASER AS A LIGHT SOURCE.
1
Grade:
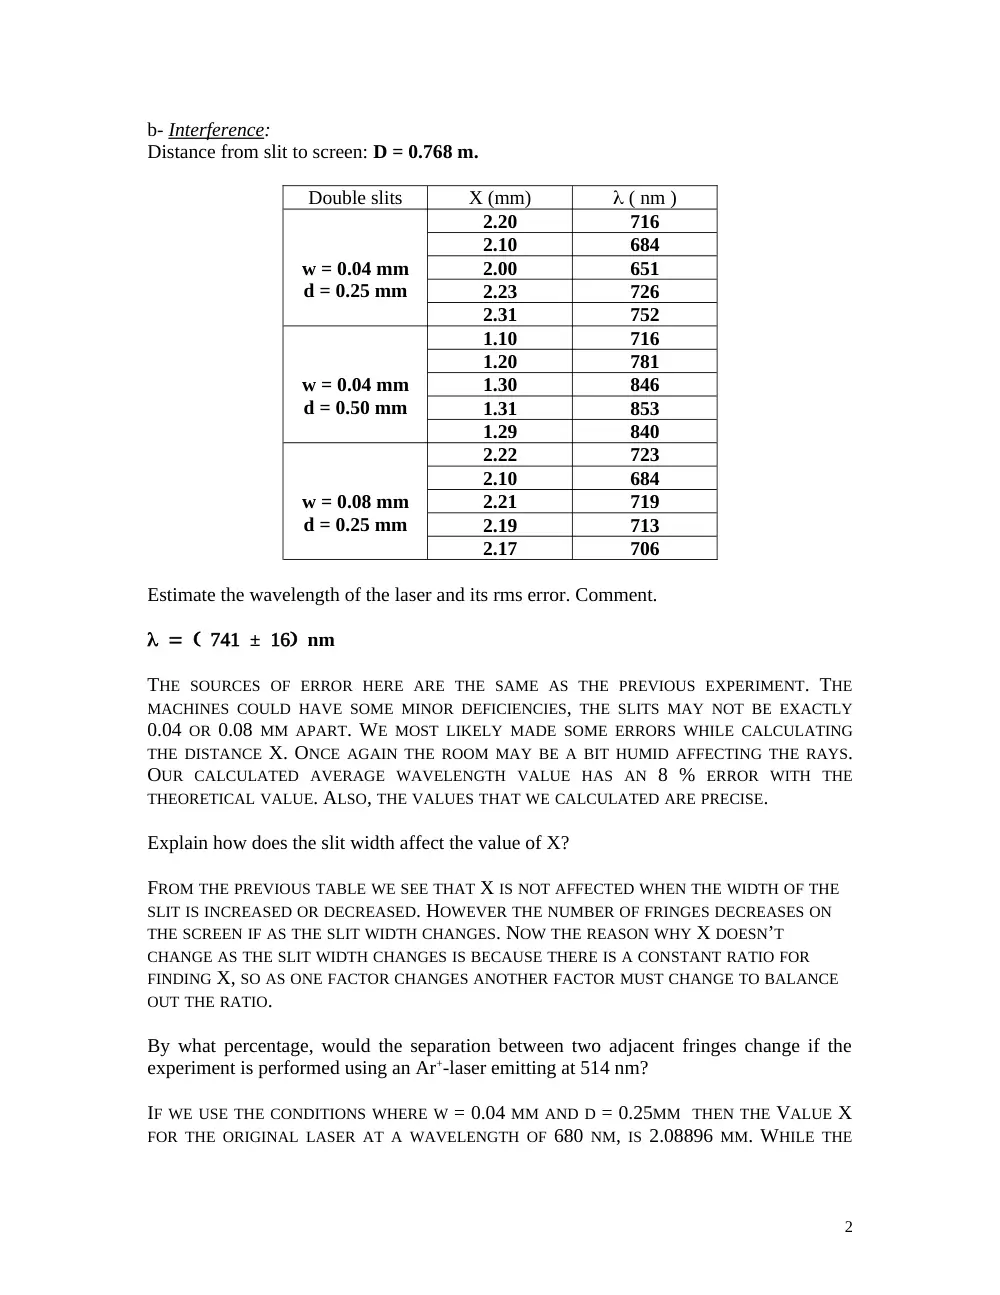
b- Interference:
Distance from slit to screen: D = 0.768 m.
Double slits
X (mm)
( nm )
w = 0.04 mm
d = 0.25 mm
2.20
716
2.10
684
2.00
651
2.23
726
2.31
752
w = 0.04 mm
d = 0.50 mm
1.10
716
1.20
781
1.30
846
1.31
853
1.29
840
w = 0.08 mm
d = 0.25 mm
2.22
723
2.10
684
2.21
719
2.19
713
2.17
706
Estimate the wavelength of the laser and its rms error. Comment.
±nm
THE SOURCES OF ERROR HERE ARE THE SAME AS THE PREVIOUS EXPERIMENT. THE
MACHINES COULD HAVE SOME MINOR DEFICIENCIES, THE SLITS MAY NOT BE EXACTLY
0.04 OR 0.08 MM APART. WE MOST LIKELY MADE SOME ERRORS WHILE CALCULATING
THE DISTANCE X. ONCE AGAIN THE ROOM MAY BE A BIT HUMID AFFECTING THE RAYS.
OUR CALCULATED AVERAGE WAVELENGTH VALUE HAS AN 8 % ERROR WITH THE
THEORETICAL VALUE. ALSO, THE VALUES THAT WE CALCULATED ARE PRECISE.
Explain how does the slit width affect the value of X?
FROM THE PREVIOUS TABLE WE SEE THAT X IS NOT AFFECTED WHEN THE WIDTH OF THE
SLIT IS INCREASED OR DECREASED. HOWEVER THE NUMBER OF FRINGES DECREASES ON
THE SCREEN IF AS THE SLIT WIDTH CHANGES. NOW THE REASON WHY X DOESN’T
CHANGE AS THE SLIT WIDTH CHANGES IS BECAUSE THERE IS A CONSTANT RATIO FOR
FINDING X, SO AS ONE FACTOR CHANGES ANOTHER FACTOR MUST CHANGE TO BALANCE
OUT THE RATIO.
By what percentage, would the separation between two adjacent fringes change if the
experiment is performed using an Ar+-laser emitting at 514 nm?
IF WE USE THE CONDITIONS WHERE W = 0.04 MM AND D = 0.25MM THEN THE VALUE X
FOR THE ORIGINAL LASER AT A WAVELENGTH OF 680 NM, IS 2.08896 MM. WHILE THE
2
VALUE OF X FOR THE ARGON CATION LASER IS 1.579008 MM. THE PERCENTAGE BY HOW
MUCH THE SEPARATION BETWEEN TWO ADJACENT FRINGES WOULD CHANGE IS 24.4 %.
3
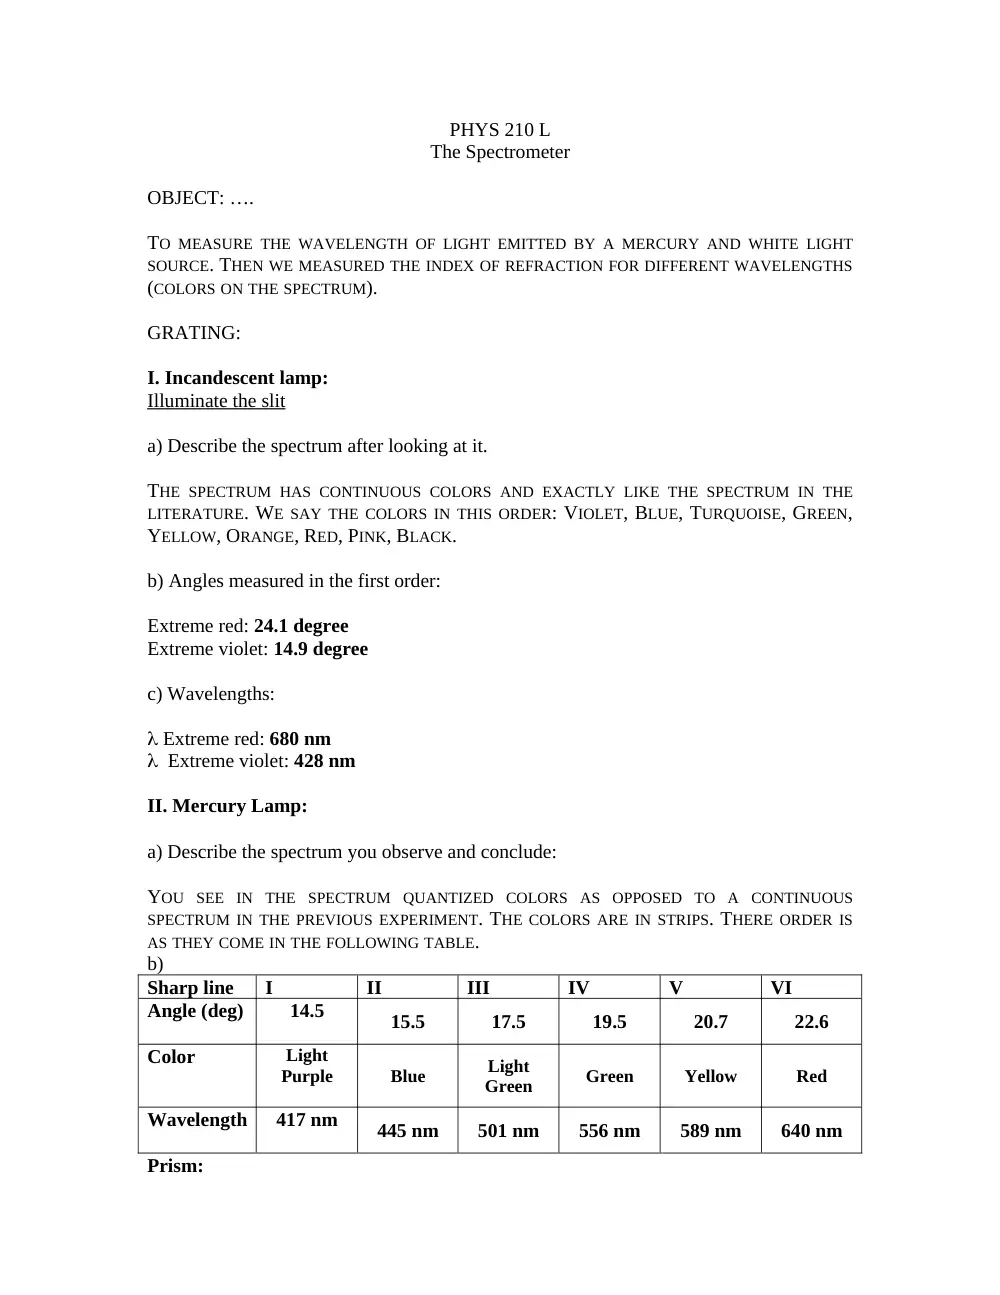
PHYS 210 L
The Spectrometer
OBJECT: ….
TO MEASURE THE WAVELENGTH OF LIGHT EMITTED BY A MERCURY AND WHITE LIGHT
SOURCE. THEN WE MEASURED THE INDEX OF REFRACTION FOR DIFFERENT WAVELENGTHS
(COLORS ON THE SPECTRUM).
GRATING:
I. Incandescent lamp:
Illuminate the slit
a) Describe the spectrum after looking at it.
THE SPECTRUM HAS CONTINUOUS COLORS AND EXACTLY LIKE THE SPECTRUM IN THE
LITERATURE. WE SAY THE COLORS IN THIS ORDER: VIOLET, BLUE, TURQUOISE, GREEN,
YELLOW, ORANGE, RED, PINK, BLACK.
b) Angles measured in the first order:
Extreme red: 24.1 degree
Extreme violet: 14.9 degree
c) Wavelengths:
Extreme red: 680 nm
Extreme violet: 428 nm
II. Mercury Lamp:
a) Describe the spectrum you observe and conclude:
YOU SEE IN THE SPECTRUM QUANTIZED COLORS AS OPPOSED TO A CONTINUOUS
SPECTRUM IN THE PREVIOUS EXPERIMENT. THE COLORS ARE IN STRIPS. THERE ORDER IS
AS THEY COME IN THE FOLLOWING TABLE.
b)
Sharp line
I
II
III
IV
V
VI
Angle (deg)
14.5
15.5
17.5
19.5
20.7
22.6
Color
Light
Purple
Blue
Light
Green
Green
Yellow
Red
Wavelength
417 nm
445 nm
501 nm
556 nm
589 nm
640 nm
Prism:
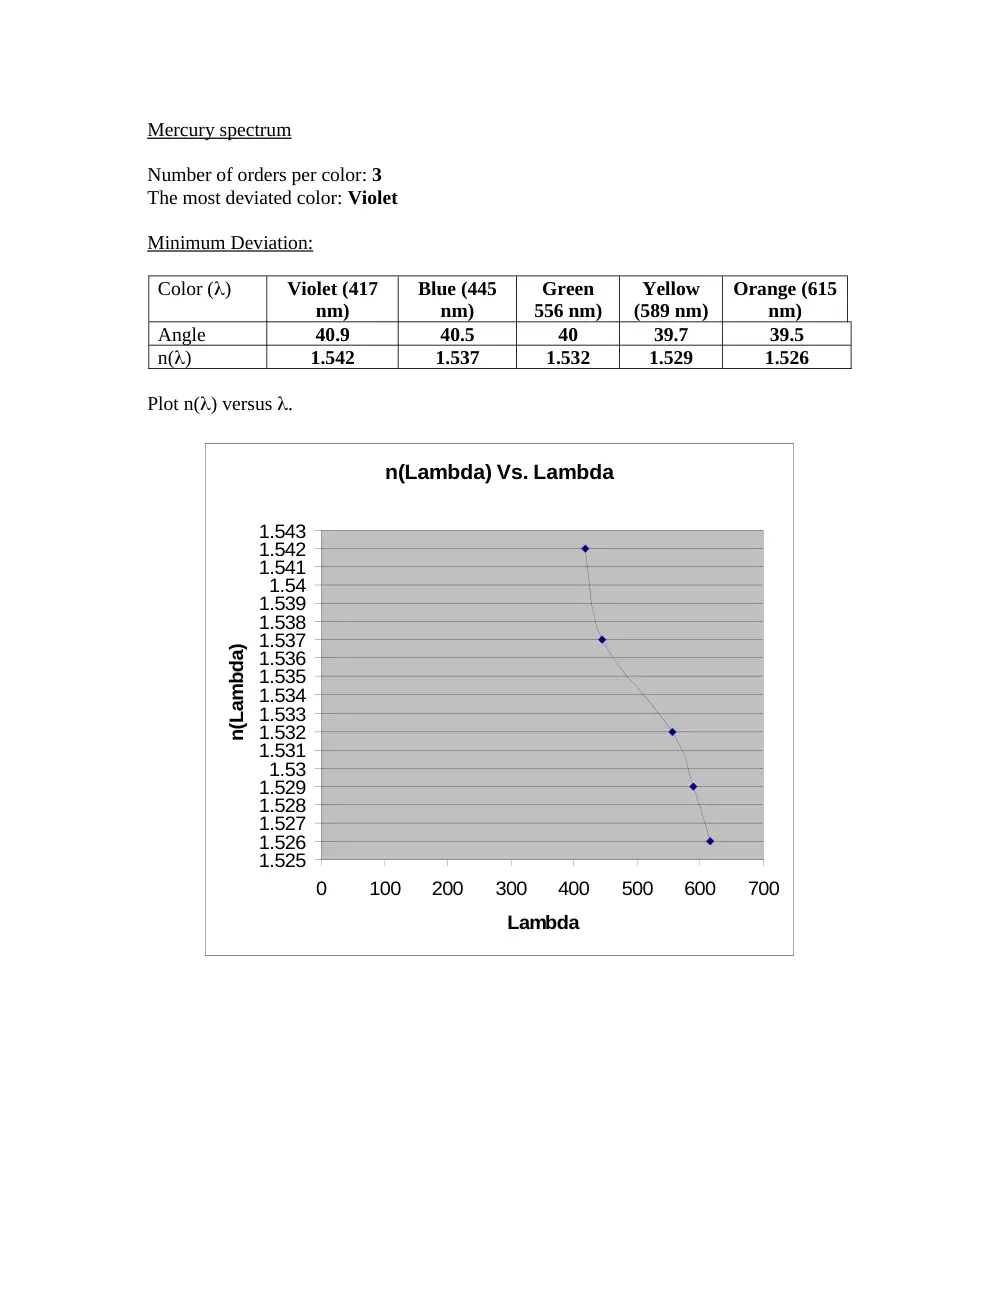
Mercury spectrum
Number of orders per color: 3
The most deviated color: Violet
Minimum Deviation:
Color ()
Violet (417
nm)
Blue (445
nm)
Green
556 nm)
Yellow
(589 nm)
Orange (615
nm)
Angle
40.9
40.5
40
39.7
39.5
n()
1.542
1.537
1.532
1.529
1.526
Plot n() versus .
n(Lambda) Vs. Lambda
1.525
1.526
1.527
1.528
1.529
1.53
1.531
1.532
1.533
1.534
1.535
1.536
1.537
1.538
1.539
1.54
1.541
1.542
1.543
0
100
200
300
400
500
600
700
Lambda
n(Lambda)
Date: 25/10/2006
Physics 210L
Atwood’s machine
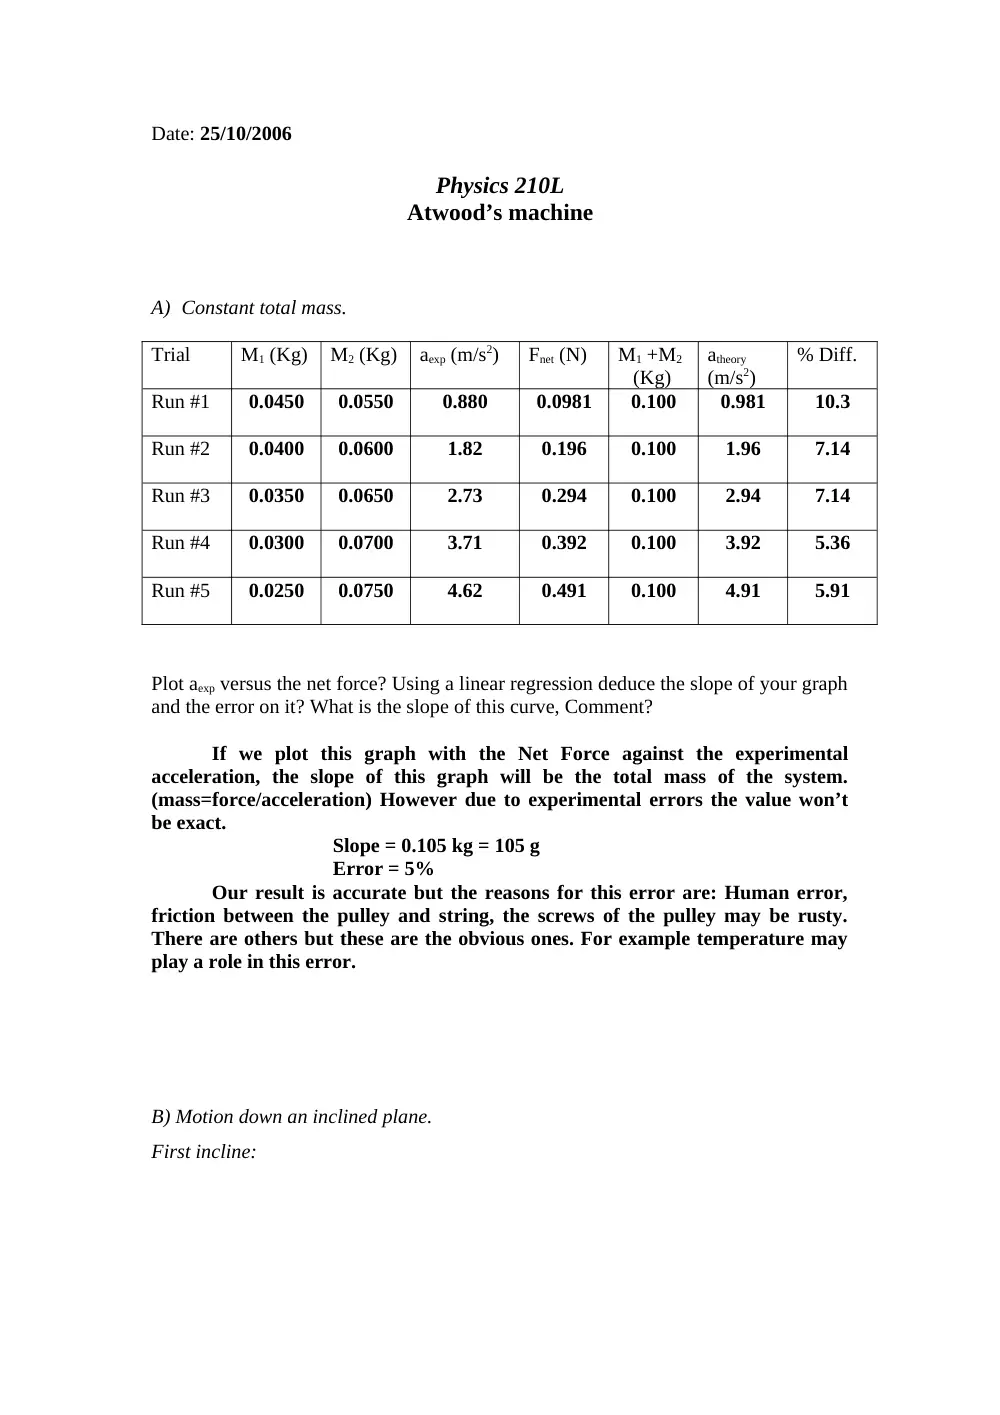
A) Constant total mass.
Trial
M1 (Kg)
M2 (Kg)
aexp (m/s2)
Fnet (N)
M1 +M2
(Kg)
atheory
(m/s2)
% Diff.
Run #1
0.0450
0.0550
0.880
0.0981
0.100
0.981
10.3
Run #2
0.0400
0.0600
1.82
0.196
0.100
1.96
7.14
Run #3
0.0350
0.0650
2.73
0.294
0.100
2.94
7.14
Run #4
0.0300
0.0700
3.71
0.392
0.100
3.92
5.36
Run #5
0.0250
0.0750
4.62
0.491
0.100
4.91
5.91
Plot aexp versus the net force? Using a linear regression deduce the slope of your graph
and the error on it? What is the slope of this curve, Comment?
If we plot this graph with the Net Force against the experimental
acceleration, the slope of this graph will be the total mass of the system.
(mass=force/acceleration) However due to experimental errors the value won’t
be exact.
Slope = 0.105 kg = 105 g
Error = 5%
Our result is accurate but the reasons for this error are: Human error,
friction between the pulley and string, the screws of the pulley may be rusty.
There are others but these are the obvious ones. For example temperature may
play a role in this error.
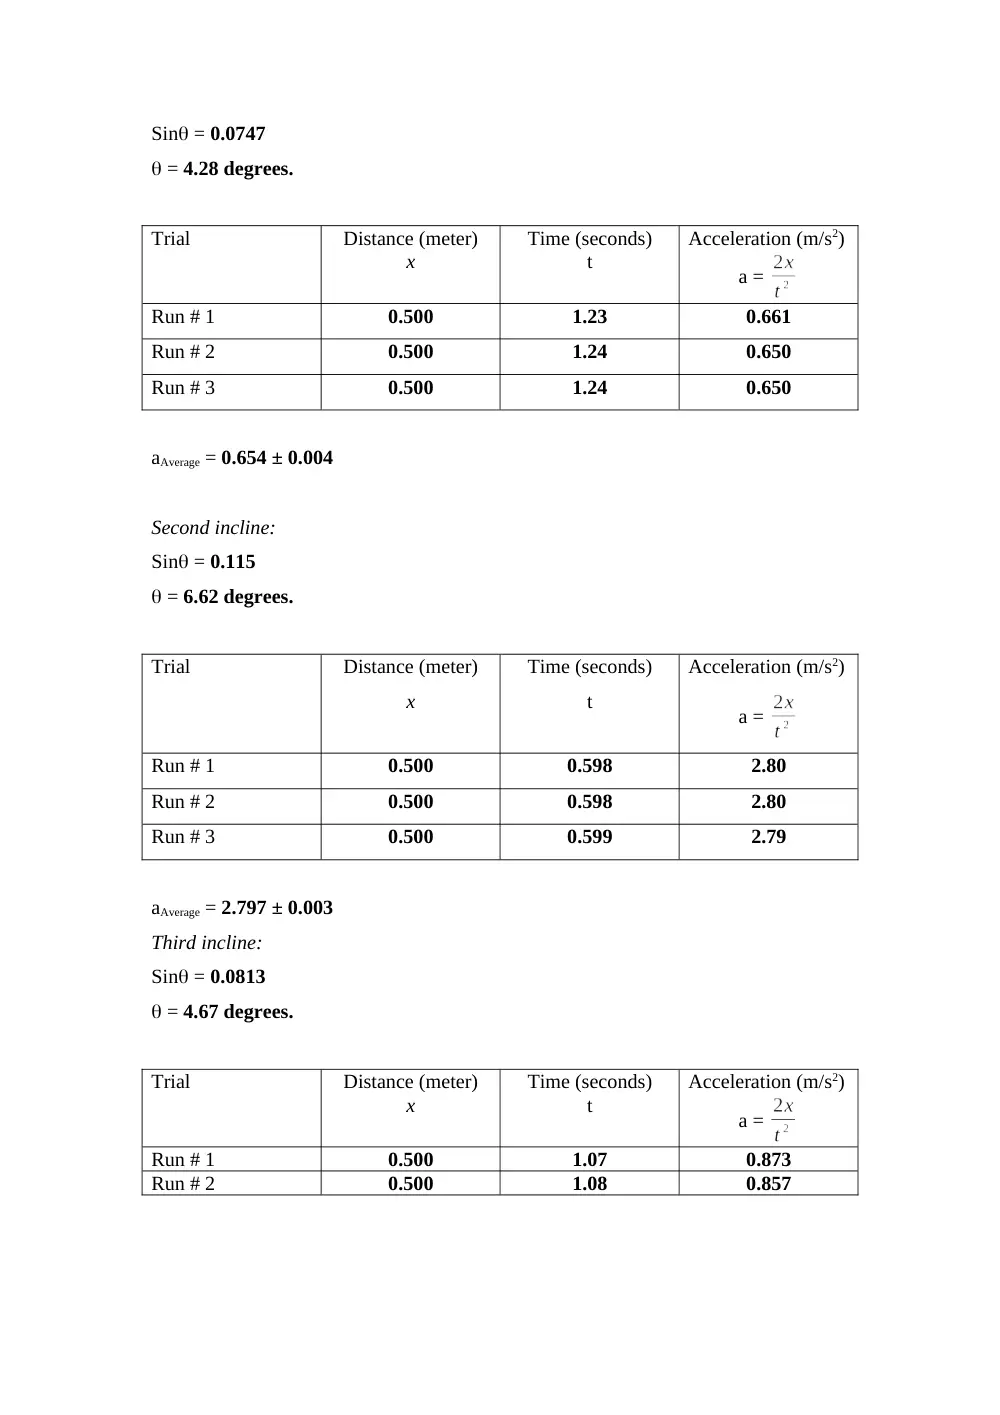
B) Motion down an inclined plane.
First incline:
Sin = 0.0747
= 4.28 degrees.
Trial
Distance (meter)
x
Time (seconds)
t
Acceleration (m/s2)
a =
Run # 1
0.500
1.23
0.661
Run # 2
0.500
1.24
0.650
Run # 3
0.500
1.24
0.650
aAverage = 0.654 ± 0.004
Second incline:
Sin = 0.115
= 6.62 degrees.
Trial
Distance (meter)
x
Time (seconds)
t
Acceleration (m/s2)
a =
Run # 1
0.500
0.598
2.80
Run # 2
0.500
0.598
2.80
Run # 3
0.500
0.599
2.79
aAverage = 2.797 ± 0.003
Third incline:
Sin = 0.0813
= 4.67 degrees.
Trial
Distance (meter)
x
Time (seconds)
t
Acceleration (m/s2)
a =
Run # 1
0.500
1.07
0.873
Run # 2
0.500
1.08
0.857
Run # 3
0.500
1.07
0.873
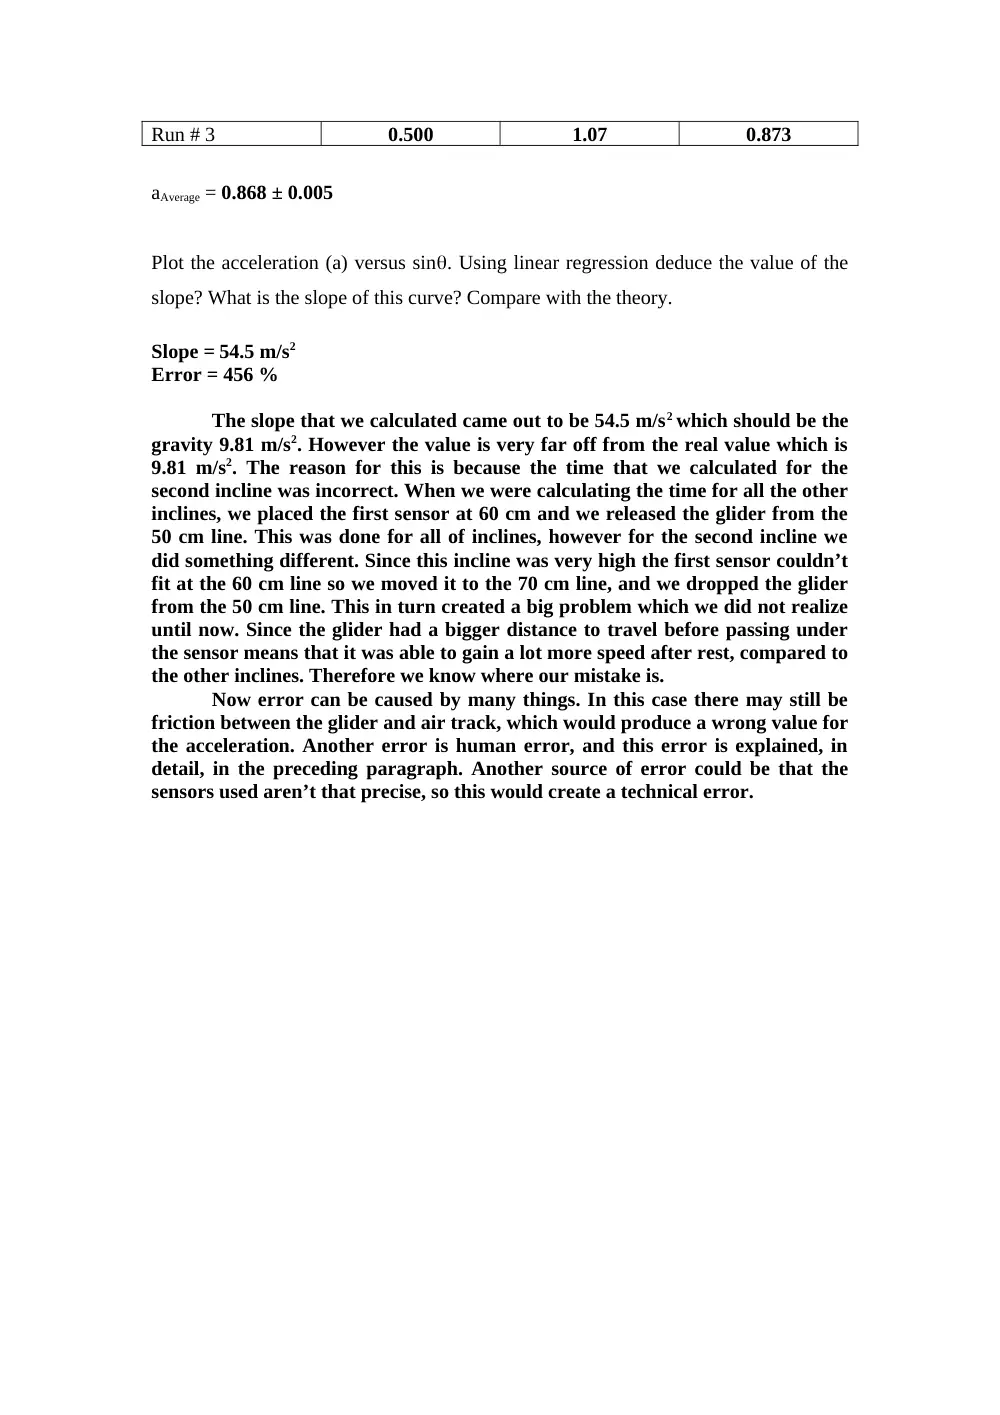
aAverage = 0.868 ± 0.005
Plot the acceleration (a) versus sin. Using linear regression deduce the value of the
slope? What is the slope of this curve? Compare with the theory.
Slope = 54.5 m/s2
Error = 456 %
The slope that we calculated came out to be 54.5 m/s2 which should be the
gravity 9.81 m/s2. However the value is very far off from the real value which is
9.81 m/s2. The reason for this is because the time that we calculated for the
second incline was incorrect. When we were calculating the time for all the other
inclines, we placed the first sensor at 60 cm and we released the glider from the
50 cm line. This was done for all of inclines, however for the second incline we
did something different. Since this incline was very high the first sensor couldn’t
fit at the 60 cm line so we moved it to the 70 cm line, and we dropped the glider
from the 50 cm line. This in turn created a big problem which we did not realize
until now. Since the glider had a bigger distance to travel before passing under
the sensor means that it was able to gain a lot more speed after rest, compared to
the other inclines. Therefore we know where our mistake is.
Now error can be caused by many things. In this case there may still be
friction between the glider and air track, which would produce a wrong value for
the acceleration. Another error is human error, and this error is explained, in
detail, in the preceding paragraph. Another source of error could be that the
sensors used aren’t that precise, so this would create a technical error.
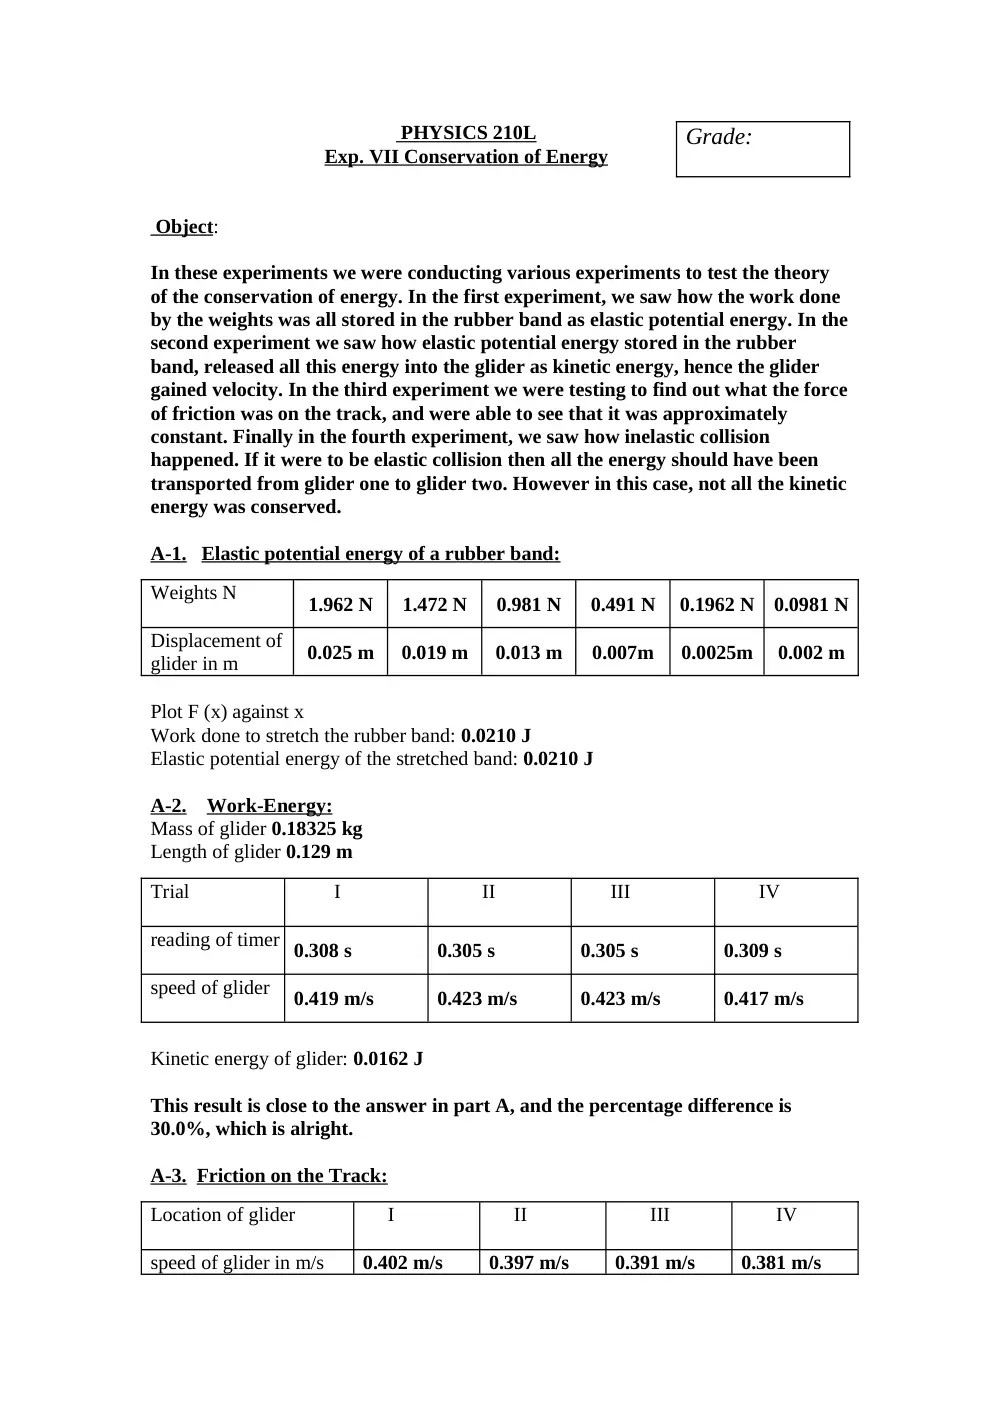
PHYSICS 210L
Exp. VII Conservation of Energy
Object:
In these experiments we were conducting various experiments to test the theory
of the conservation of energy. In the first experiment, we saw how the work done
by the weights was all stored in the rubber band as elastic potential energy. In the
second experiment we saw how elastic potential energy stored in the rubber
band, released all this energy into the glider as kinetic energy, hence the glider
gained velocity. In the third experiment we were testing to find out what the force
of friction was on the track, and were able to see that it was approximately
constant. Finally in the fourth experiment, we saw how inelastic collision
happened. If it were to be elastic collision then all the energy should have been
transported from glider one to glider two. However in this case, not all the kinetic
energy was conserved.
A-1. Elastic potential energy of a rubber band:
Weights N
1.962 N
1.472 N
0.981 N
0.491 N
0.1962 N
0.0981 N
Displacement of
glider in m
0.025 m
0.019 m
0.013 m
0.007m
0.0025m
0.002 m
Plot F (x) against x
Work done to stretch the rubber band: 0.0210 J
Elastic potential energy of the stretched band: 0.0210 J
A-2. Work-Energy:
Mass of glider 0.18325 kg
Length of glider 0.129 m
Trial
I
II
III
IV
reading of timer 0.308 s
0.305 s
0.305 s
0.309 s
speed of glider
0.419 m/s
0.423 m/s
0.423 m/s
0.417 m/s
Kinetic energy of glider: 0.0162 J
This result is close to the answer in part A, and the percentage difference is
30.0%, which is alright.
A-3. Friction on the Track:
Location of glider
I
II
III
IV
speed of glider in m/s
0.402 m/s
0.397 m/s
0.391 m/s
0.381 m/s
Grade:
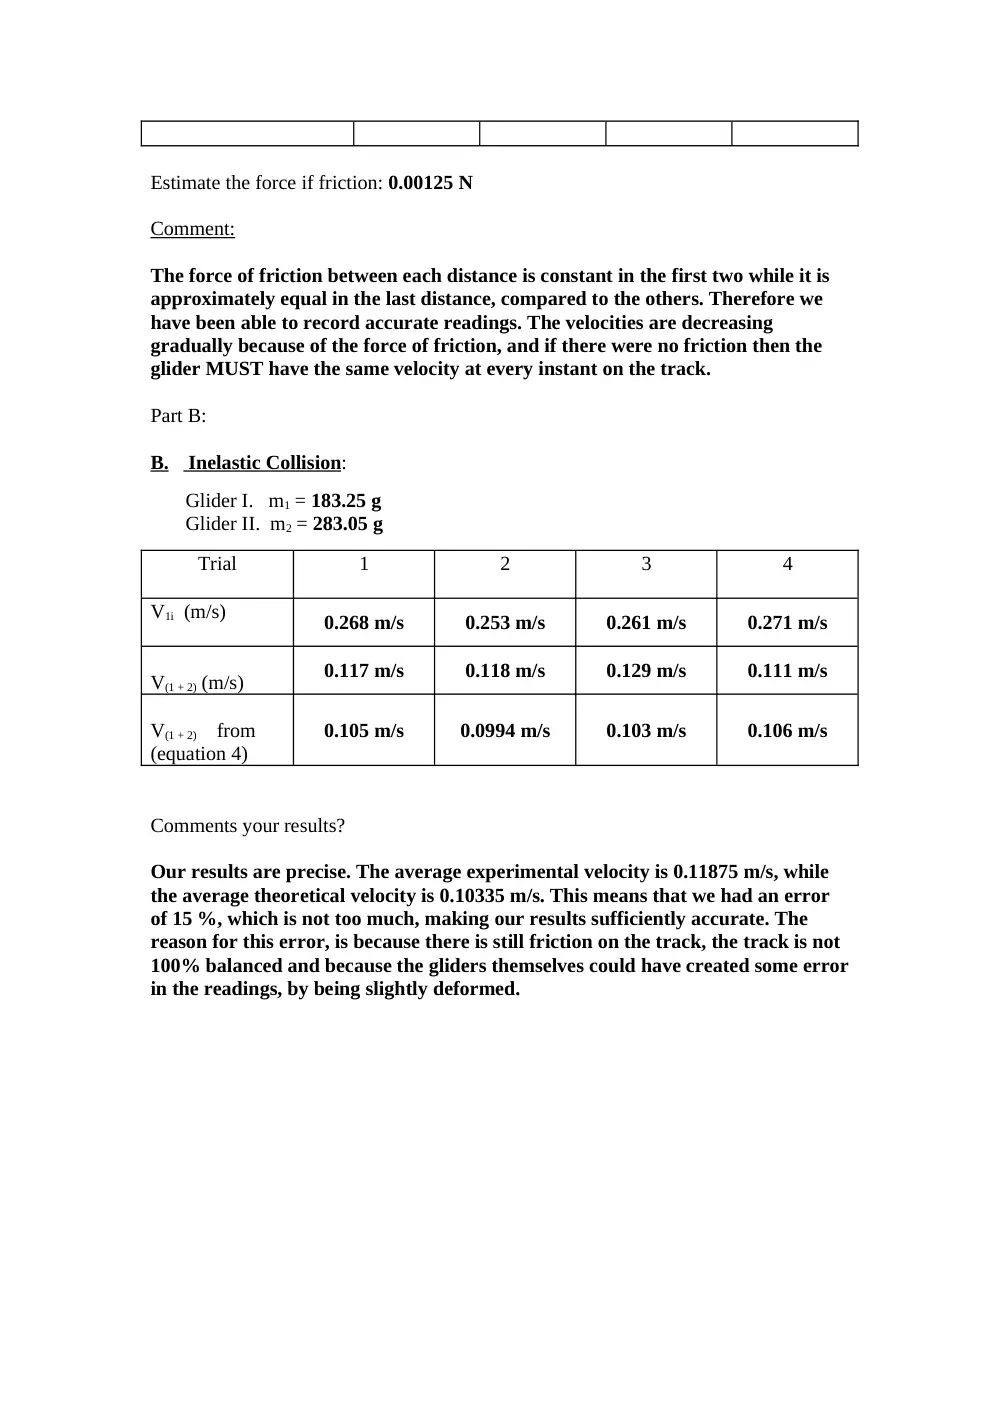
Estimate the force if friction: 0.00125 N
Comment:
The force of friction between each distance is constant in the first two while it is
approximately equal in the last distance, compared to the others. Therefore we
have been able to record accurate readings. The velocities are decreasing
gradually because of the force of friction, and if there were no friction then the
glider MUST have the same velocity at every instant on the track.
Part B:
B. Inelastic Collision
:
Glider I. m1 = 183.25 g
Glider II. m2 = 283.05 g
Trial
1
2
3
4
V1i (m/s)
0.268 m/s
0.253 m/s
0.261 m/s
0.271 m/s
V(1 + 2) (m/s)
0.117 m/s
0.118 m/s
0.129 m/s
0.111 m/s
V(1 + 2) from
(equation 4)
0.105 m/s
0.0994 m/s
0.103 m/s
0.106 m/s
Comments your results?
Our results are precise. The average experimental velocity is 0.11875 m/s, while
the average theoretical velocity is 0.10335 m/s. This means that we had an error
of 15 %, which is not too much, making our results sufficiently accurate. The
reason for this error, is because there is still friction on the track, the track is not
100% balanced and because the gliders themselves could have created some error
in the readings, by being slightly deformed.
Date: 15/11/2006
Physics 210L
Exp. 1.
Surface Tension & Viscosity
A- Surface Tension measurements
Radius of Aluminum ring R = 5.82 cm; Thickness of Ring = 1.0 mm.
Weight of Ring W = 0.049 N
i- Water
Water temperature = 22.5 oC
Trial number
F (N)
Surface tension force (N)
(N/m)
Trial 1
0.0630
0.0140
0.0192
Trial 2
0.0632
0.0142
0.0194
Trial 3
0.0634
0.0144
0.0197
Trial 4
0.0633
0.0143
0.0196
Trial 5
0.0634
0.0144
0.0197
From this table, calculate the average value of water and its rms error
water
= 0.0195 0.0001 N/m
ii -Cold Water
Water temperature = 6.1 oC
Trial number
F (N)
Surface tension force (N)
(N/m)
Trial 1
0.0635
0.0145
0.0198
Trial 2
0.0631
0.0141
0.0193
Trial 3
0.0630
0.0140
0.0192
Trial 4
0.0633
0.0143
0.0196
Trial 5
0.0641
0.0151
0.0207
From this table, calculate the average value of water .
water
= 0.0197 0.0003 N/m
iii- Soapy Water
Trial number
F (N)
Surface tension force (N)
(N/m)
Grade:
Trial 1
0.0610
0.0120
0.0164
Trial 2
0.0611
0.0121
0.0166
Trial 3
0.0610
0.0120
0.0164
Trial 4
0.0605
0.0115
0.0157
Trial 5
0.0608
0.0118
0.0161
From this table, calculate the average value of soapy water.
soapy water
= 0.0162 0.0002 N/m
QUESTIONS:
1) According to your experimental data, which has the largest value of , water or
soapy water? Is this to be expected?
THE LARGEST SURFACE TENSION IS FOR THE WATER, AT ROOM TEMPERATURE. YES
THIS IS TO BE EXPECTED. THIS IS SO SINCE SOAP IS SUPPOSED TO MAKE THE SURFACE
TENSION LESS. THIS IS EXACTLY THE PRINCIPLE THAT DETERGENT USES TO CLEAN
CLOTHES IN WASH MACHINES. IT DECREASES THE SURFACE TENSION SO THAT WATER
PENETRATES THE CLOTHES EASIER, TO CLEAN THEM.
2) What is the effect of temperature on your measurements of surface tension?
Comment.
BASED ON OUR RESULTS, THE SURFACE TENSION INCREASES AS THE
TEMPERATURE INCREASES. THIS IS SO SINCE AS THE TEMPERATURE DECREASES THE
THERE IS LESS ENERGY IN THE SYSTEM. WHEN THE TEMPERATURE INCREASES HIGHER
ENERGY ALLOWS MOLECULES TO OVERCOME THE FORCES BETWEEN ONE ANOTHER,
MAKING THE LIQUID LESS VISCOUS. HOWEVER IF THE TEMPERATURE DECREASES THEN
THERE IS LESS ENERGY AND THE MOLECULES ARE MORE ATTRACTED TO EACH OTHER.
THERE WILL BE HIGHER FORCES OF ATTRACTION BETWEEN EACH OTHER.
B- Viscosity
Length and radius of capillary tube: l = 14.45 cm and R = 0.08 cm.
h (cm)
hf (cm)
h(cm)
Volume (cm3)
Time (s)
Temp. (oC)
Q(cm3/s)
(kg/
m.s)
8.18
7.97
8.08
12.0
9.9
22.7
1.21
0.00203
7.97
7.74
7.86
18.0
11.98
22.9
1.50
0.00162
8.28
8.19
8.24
8.00
4.38
22.9
1.83
0.00135
8.28
8.15
8.22
10.0
5.66
22.7
1.77
0.00140
8.28
8.16
8.22
9.00
5.45
22.7
1.65
0.00150
8.27
8.01
8.14
20.5
12.4
22.7
1.65
0.00150
8.21
7.89
8.05
24.0
14.91
22.7
1.61
0.00153
7.89
7.53
7.71
28.0
19.66
22.8
1.42
0.00170
From your results, calculate the average coefficient of viscosity and its root-mean-
square error. How does your value compare with the accepted value of the viscosity of
water? Calculate the relative error on your measured value.
= 0.00158 0.00008
0.00158 PA*S = 1.58 CP (CENTI-POISE)
THE VISCOSITY OF WATER AT 200C IS 1.002 CP. THEREFORE OUR VALUE IS VERY CLOSE
TO THE LITERATURE VALUE OF THE VISCOSITY OF WATER.
OUR ERROR THEREFORE IS THE ABSOLUTE VALUE OF THE THEORETICAL VALUE MINUS
THE EXPERIMENTAL VALUE. THEN DIVIDE THAT BY THE THEORETICAL VALUE AND
MULTIPLY BY 100.
SO THE ERROR = 57.7%
THIS IS AN ACCEPTABLE VALUE.
PHYSICS 210L
Thermal Expansion of Solids
Date: 29/11/2006
1.DATA:
(a) Copper:
L0 (mm)
Rrm (k
Trm (C)
Rhot (k
Thot (C)
T (C)
L (mm)
700
99.8
25
6.9
93
68
0.925
What are the values of:
T = ± 1 C
L = ± 0.005 mm L0 = ± 0.5 mm
Estimate the value of (for copper) and its rms error. Show your calculation of
error propagation. Comment
Copper = (19.4 0.3)*10-6 /C
Calculate the percentage error of your measurement compared to the accepted
value copper = 17.610-6 /C.
WE HAVE AN ERROR OF 10.2 %
THIS IS FOUND BY USING THE FORMULA OF PERCENTAGE ERROR.
(b) Steel:
L0 (mm)
Rrm (k
Trm (C)
Rhot (k
Thot (C)
T (C)
L (mm)
700
108.1
23
8
88.5
65.5
0.67
Estimate the value of (for Steel) and its rms error. Show your calculation of
error propagation. Comment
Steel = (14.6 0.2)*10-6 /C
Calculate the percentage error of your measurement compared to the accepted
value steel = 12.410-6 /C.
1
Grade:
IN THIS EXPERIMENT WE HAVE A PERCENTAGE ERROR OF 17.7%. ONCE AGAIN WE
USED THE FORMULA FOR PERCENT ERROR TO FIND THE VALUE OF THE ERROR.
(c) Aluminum:
L0 (mm)
Rrm (k
Trm (C)
Rhot (k
Thot (C)
T (C)
L (mm)
700
97.3
25.5
8.5
88.5
63
1.21
Estimate the value of (Aluminum) and its rms error. Comment
Aluminum = (2.74 0.05)*10-5 /C
Comment on the precision and accuracy of your measurements and speculate on the
possible sources of error in your experiment.
ALL OUR VALUES ARE ACCURATE. HOWEVER, WE ARE NOT SURE ABOUT THE LAST
MEASUREMENT SINCE WE CAN NOT COMPARE IT WITH ANYTHING. BUT, SINCE THE
OTHER ONES WERE VERY ACCURATE, AND SINCE WE FOLLOWED THE SAME STEPS IN
THIS EXPERIMENT, ALL OUR VALUES MUST BE ACCURATE AND PRECISE. WE HAVE
HIGH PRECISION BECAUSE THE ERRORS ON THE VALUES ARE LOW. OF COURSE OUR
SOURCES OF ERROR ARE OBVIOUS. WE MAY HAVE ASSUMED THE WRONG
TEMPERATURE WHILE LOOKING FOR IT ON THE SCALE OF COMPARISON. WE DIDN'T
CALCULATE THE EXACT MAXIMUM OF THE L. THERE MAY HAVE BEEN ERRORS IN
THE EQUIPMENT THAT WE USED.
From your result, calculate the coefficients of volume expansion for copper, Steel and
aluminum?
β=3
βCopper = (5.82 0.3)*10-5 /C
βSteel = (4.38 0.06)*10-5 /C
βAluminum = (8.2 0.2)*10-5 /C
2
Date: 13/12/2006
Physics 210L
Mechanical Equivalent of Heat
Experimental procedure:
Copper (g)
Aluminum (g)
Iron (g)
Weight of the calorimeter
and uncertainty on measurement
645.7
212.2
580.5
Measure the diameter (d) of each calorimeter 4 times.
Calculate the average value and the root mean square error.
Copper ( cm )
Aluminum ( cm )
Iron ( cm )
4.64
4.65
4.66
4.63
4.66
4.65
4.65
4.64
4.66
4.64
4.65
4.66
Average: 4.640
4.650
4.658
Root mean square: 0.004
0.004
0.003
A- Copper
Record the initial temperature Ti final temperature Tf and number of turns n.
Record the weight attached: 5.00 Kg
Ti
Tf
T
n
first reading
25.3 oC
33.3 oC
8.0 oC
300 oC
second reading
33.3 oC
39.2 oC
5.9 oC
300 oC
third reading
39.2 oC
47.1 oC
7.9 oC
300 oC
Calculate the mechanical equivalent of heat in each case (show calculations)
Find its average value and its root mean square error.
J = 4.91 ± 0.5 J/kcal
Compare the result to the literature value and comment.
B- Aluminum
Record the weight attached 5 kg and the number of turn n = 300
measure Ti = 24.2 oC & Tf = 35.9 oC
Grade:
1
Find the specific heat of Aluminum and the percentage error.
Calculate the molar heat capacity, (show calculation)
C- Iron
Record the weight attached 5 kg and the number of turns n = 300
Measure Ti = 25.2 oC & Tf = 33.6 oC
Find the specific heat of iron, its rms error as calculated from the error propagation
theory (show calculation) and its rms error.
Calculate the molar heat capacity of Iron.
Are your results for Aluminum and Iron in agreement with the law of Dulong and
Petit? Comment.
THE LAW OF DULONG AND PETIT STATES THAT THE MOLAR HEAT CAPACITIES OF
SOLIDS, WITH A FEW EXCEPTIONS, HAVE VALUES CLOSE TO 6 CAL/(MOL.
OC).
THE RESULTS THAT WE GOT WERE VERY CLOSE TO THIS VALUE. THE MOLAR HEAT
CAPACITY OF ALUMINUM WAS 5.319 CAL/(MOL.
OC) AND THE MOLAR HEAT CAPACITY
OF IRON WAS 5.72 CAL/(MOL.
OC). THE PERCENT ERROR OF EACH ONE ARE AS
FOLLOWS:
Aluminum Percent Error:
Iron Percent Error:
THESE LOW ERRORS MEAN THAT OUR RESULTS WERE VERY ACCURATE. NOW WE CAN'T REALLY TALK
ABOUT PRECISION SINCE PRECISION IS DEFINED OVER A SET OF READINGS, HERE WE ONLY HAD ONE
READING. THERE ARE MANY SOURCES FOR THIS ERROR: EQUIPMENT PROBLEMS, US, NOT ENOUGH
CONTACT BETWEEN THE ROPE AND THE CYLINDRICAL PIECE OF METAL, ETC…
2
Physics 210L
Standing Sound Waves in Air Columns Grade:
Tube length and resonant modes:
i. Determination of piston positions that produce standing waves:
Freq.= 1.0 kHz
Freq.= 1.5 kHz
Freq.= 2.0 kHz
Freq.= 2.5 kHz
Piston Positions
(cm)
Piston Positions
(cm)
Piston Positions
(cm)
Piston Positions
(cm)
72.5
71.5
73.0
75.5
55.7
60.0
63.8
68.5
39.0
48.5
54.8
61.6
21.6
36.6
45.9
49.8
4.00
25.0
36.0
48.0
13.5
28.0
41.1
3.00
19.0
34.5
9.90
27.6
0.600
20.7
13.8
7.05
ii. Determination of the speed of sound in air:
Frequency (kHz)
0.5
1.0
1.5
2.0
d (cm)
33.5
17.125
11.42
8.95
v (m/s)
335
342.5
342.5
358
The average measured value of the speed of sound in air, vrms, is: (345 5) m/s
Compare the measured value of the speed in air to the theoretically accepted value. Show
your calculations and estimate the relative error.
1
a- Standing wave pattern in an air column
:
i. Waveform in the tube:
Frequency = 1.5 kHz
Microphone Positions
Maxima
Minima
0.5 cm
5 cm
12 cm
16.2 cm
24.8 cm
28 cm
34 cm
39.5 cm
45 cm
51.1 cm
56 cm
62.5 cm
68 56 cm
Sketch the variations of the displacement and the pressure amplitude along the tube
length. From your sketch, can you tell whether the piston and the speaker are considered
as displacement nodes or anti-nodes? Explain.
The Varying of The Displacement Amplitude
0
5
10
15
20
25
30
35
40
45
50
55
60
65
70
75
Displacement (cm)
Amplitude
The Varying of the Pressure Amplitude
0
10
20
30
40
50
60
70
80
Displacement (cm)
Amplitude
2
FROM OUR SKETCH WE CAN SEE THAT THE SPEAKER IS A DISPLACEMENT ANTI-NODE
SINCE THERE IS A MAXIMUM AMPLITUDE AT THE BEGINNING OF OUR SKETCH. HOWEVER,
SINCE THE TUBE HAS A FIXED END, THIS FIXED END DOES NOT ALLOW DISPLACEMENT
MEANING THAT THE PISTON IS A DISPLACEMENT NODE.
ii. Determination of the speed of sound in air:
Record the number of pressure nodes, N, for each value of the tube length.
Frequency = 1.5 kHz
Length (cm)
N
71.5
6
60
5
48.5
4
36.6
3
25
2
13.5
1
3
0
Plot the length of the tube as a function of the number of pressure nodes in the standing
wave pattern. What is the slope of the straight line that you have obtained? Calculate
from this slope the velocity of sound in air.
xi
yi
y
ei
ei
2
xi2
0
0.03
0
-0.03
0.00090
0
1
0.135
0.1205
-0.0145
0.000210
1
2
0.25
0.241
-0.009
8.1*10-5
4
3
0.366
0.3615
-0.0045
2.03*10-5
9
4
0.485
0.482
-0.003
9.00*10-6
16
5
0.600
0.6025
0.00250
6.25*10-6
25
6
0.715
0.844
0.129
0.0166
36
∑(ei)2 = 0.0178 (∑xi)2 = 441
∑(xi)2 = 91
∆ = 196
∑xi
= 21
THE SLOPE ERROR IS 0.0113
THE SLOPE FROM THE GRAPH IS SLOPE = (0.1205 0.01)
THE SLOPE IS EQUAL TO HALF THE WAVE LENGTH. THEREFORE THE VELOCITY IS EQUAL
TO THE PRODUCT OF (2)(SLOPE)(FREQUENCY)= (2)(0.1205)(1500) V=361.5 M/S
3
The Number of Nodes With Displacement y = 0.1205x
R2 = 0.9965
0
0.1
0.2
0.3
0.4
0.5
0.6
0.7
0.8
0
1
2
3
4
5
6
7
Number of Nodes
Length of Tube (m)
How does this value compare to the one determined in part (a) of the experiment and to
the accepted theoretical value? Comment.
THE SPEED OF SOUND FROM PART (A) AND THEORETICALLY ARE APPROXIMATELY EQUAL,
THEREFORE THE VALUE OF THE SPEED OF SOUND IN THIS PART WILL HAVE A SIMILAR
ERROR WITH THE VALUE OF PART (A). THE FIRST PERCENTAGE ERROR IS THE ERROR WITH
THE THEORETICAL VALUE OF THE SPEED OF SOUND, WHILE THE SECOND PERCENTAGE
ERROR IS THE ERROR WITH THE VALUE FROM PART (A).
4
Date: 20/12/2006
Physics 210L
Michelson Interferometer
1. Data:
Determination of the wavelength of the LASER:
dm (m)
N
(m) Eq. (1)
33.1
100
0.662
29.2
100
0.584
30.0
100
0.600
32.3
100
0.646
35.0
100
0.700
Calculate the average value of l and its rms error. Compare the expected value and
comment.
m Mean value)
±m
b. Determination of the index of refraction of air: (l=3.00 cm and = 632.8 nm)
Trials
N
nair (Eq.5)
1
11
1.00012
2
12
1.00013
3
12
1.00013
4
12
1.00013
5
11
1.00012
Calculate the average of nair and its rms error. Compare to the expected value and
comment.
nair = 1.000126 ± 0.000002
c. Determination of the index of refraction of glass:
Thickness of plate: 0.54 cm.
1
Grade:
N
Nglass (Eq.6)
110
11o
1.53
160
12o
1.73
150
11.7o
1.72
147
11.3o
1.78
170
12.05o
1.81
Calculate the average of nglass and its rms error. Compare to the expected value and
comment.
Nglass = 1.714 I used this one glass, borosilicate (pyrex) 1.474
Nglass =1.71 ± 0.05 glass, crown (soda-lime) 1.512
glass, flint (29% lead) 1.569
glass, flint (55% lead) 1.669
glass, flint (71% lead) 1.805
glass, fused silica 1.459
1. In the calculation to determine the value of λ based on the micrometer
movement, why was dm multiplied by two?
THIS IS BECAUSE A WAVE HAS TWO ABSOLUTE MAXIMUMS WHERE ONE IS A MINIMUM
AND THE OTHER IS A MAXIMUM. HOWEVER, THERE IS CONSTRUCTIVE INTERFERENCE
AT BOTH OF THESE EXTREMAS. SO THE BRIGHT LIGHTS THAT WE SAW WERE FROM THE
MAXIMUMS AND THE MINIMUMS OF EACH WAVELENGTH, MEANING THAT EVERY TWO
BRIGHT LIGHTS CORRESPONDED TO ONE WAVELENGTH.
2. To what do you attribute this difference between the measured value of nglass
& accurately known value of nglass?
THERE ARE MANY REASONS FOR ERROR BUT OUR RESULTS SHOW THAT WHAT WE DID
WAS FAIRLY ACCURATE. OUR READINGS WERE VERY PRECISE ALL THROUGH. NOW
THE REASON FOR ERROR IN THE INDEX OF REFRACTION IN GLASS COULD BE TO THE
FACT THAT THE GLASS ISN'T THAT PURE. AS YOU CAN SEE FROM THE VARIOUS
INDEXES OF REFRACTIONS OF GLASS, EACH TYPE OF GLASS HAS A DIFFERENT
COMPOSITION. SO THERE MAY BE IMPROPER MEASUREMENTS FOR THE COMPOSITION
OF GLASS. THE GLASS MAY NOT BE AS CLEAR AS IT SHOULD BE WHICH WOULD REPEL
SOME OF THE LASER BEAM'S RAYS. OF COURSE THE EQUIPMENT IN GENERAL MAY NOT
BE ACCURATE. ALSO OUR READING OF THE MEASUREMENTS MAY NOT HAVE BEEN SO
PRECISE BECAUSE EVERYTHING WAS DELICATE. SO THERE ARE MANY SOURCES OF
ERROR FOR FINDING THE INDEX OF REFRACTION OF GLASS.
2