
ENV 200 Chapter 5, Fall 2013
Lebanese American University · Introduction To Enviromental Sciences · 74 pages



Showing the first 10 of 74 pages. Download the PDF to see all of it.
More ENV 200 files
Show the text of this chapter
Energy
Energy
• The capacity to do work or transfer heat
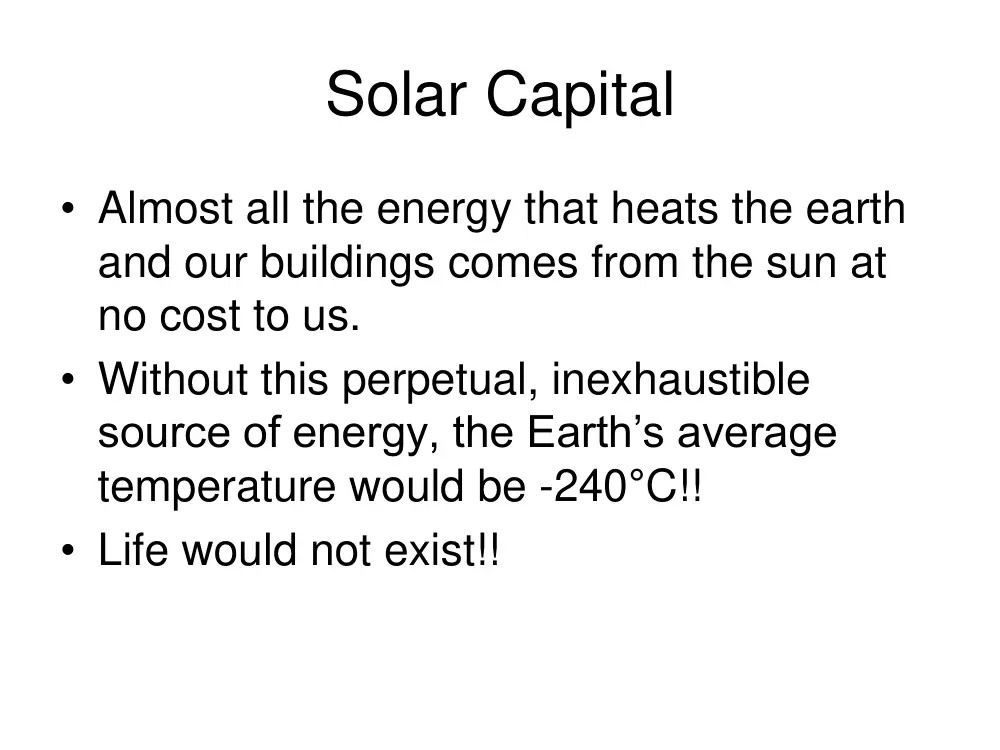
Solar Capital
• Almost all the energy that heats the earth
and our buildings comes from the sun at
no cost to us.
• Without this perpetual, inexhaustible
source of energy, the Earth’s average
temperature would be -240°C!!
• Life would not exist!!
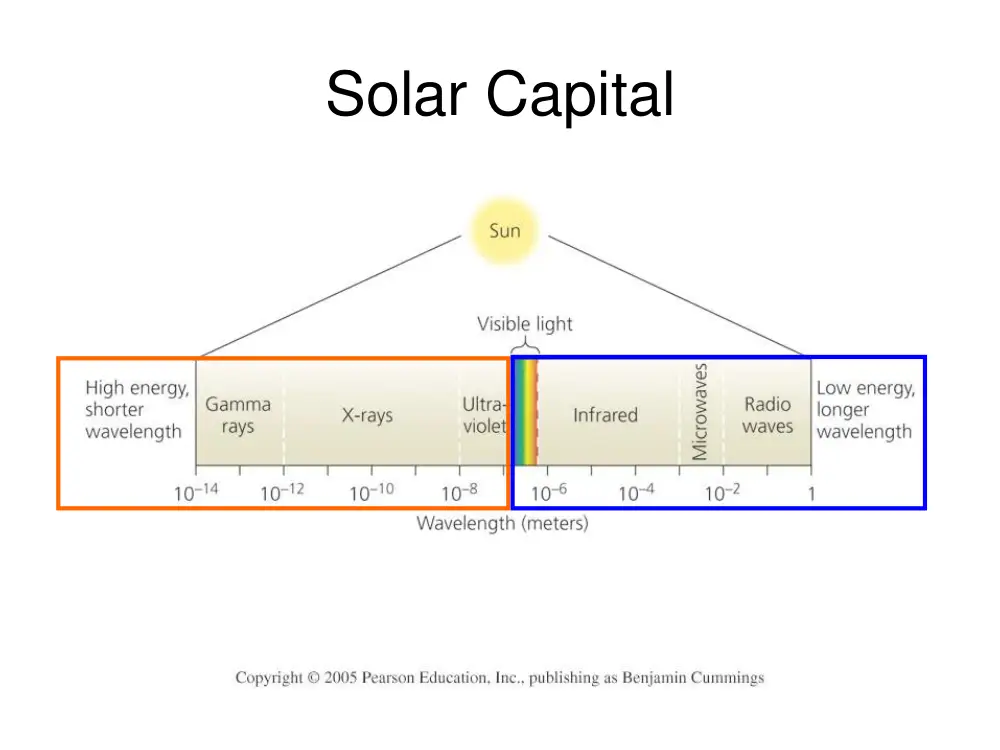
Solar Capital
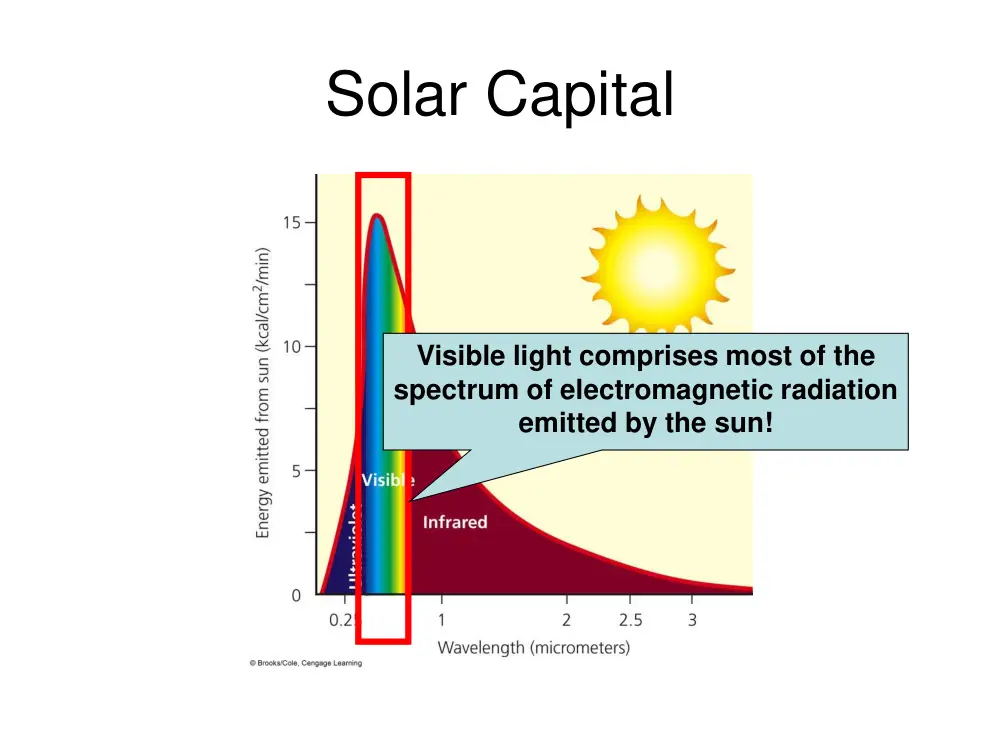
Solar Capital
Visible light comprises most of the
spectrum of electromagnetic radiation
emitted by the sun!
Energy Transformation
Energy Transformation
• When driving your car, only 6% of the high
quality energy available in its gasoline fuel
actually moves the car.
• 94% of the high quality energy is released
as low quality heat!
• 94% of the money you spent on gasoline
is wasted!!
Energy Efficiency
• Also known as energy productivity
• A measure of how much useful work is
accomplished by a particular input of
energy into a system
Energy Efficiency
Plenty of room for improvement!!
Stop wasting energy!!
Energy Efficiency in the United States of
America
Perform useful
w ork 16%
Unnecessarily
w asted 43%
Wasted through
second law of
thermodynamics
41%
Energy Quality
• A measure of an energy source’s capacity to do
useful work; The amount of energy available that
can perform useful work
– High-quality energy: concentrated; has a high
capacity to do useful work
• Examples: Very high-temperature heat, concentrated
sunlight, high velocity wind, energy from burning fossil fuels
– Low-quality energy: dispersed; has little capacity to
do useful work
• Examples: Amount of heat stored in a large amount of matter
(The Atlantic for example)
Energy
In terms of renewability:
Perpetual
Solar, wind, hydroelectric
Renewable
Renewable, but not on human
timescales
Fossil fuels, nuclear
Considered non-renewable for practical
purposes
Solar Energy
• Direct and Indirect
• Direct solar energy produces several
forms of renewable energy (Indirect solar
energy):
– Wind (Moving air masses heated by the sun)
– Hydropower (Flowing water kept fluid by the
sun)
– Biomass (Solar energy converted to chemical
energy and stored in plants)
History of Human Energy Use
History of Human Energy Use
• Muscle power
• Fire as first step along the energy path
• Muscle power; domesticated wild animals
• Wind and flowing water
• Steam engine operated on wood; deplete forests
• Coal, then oil
• Nuclear energy
• Energy crisis
History of Human Energy Use
• 2000 kilocalories per person per day for
hunters and gatherers
• Additional 600,000 kilocalories per person
per day for modern humans; mainly used
by machines and systems that maintain
our complex lifestyle
Sources of Energy
• Commercial energy: energy sold on the
market
– Non-renewable sources: mainly carbon-
containing fossil fuels (oil, coal, natural gas) –
We live in a fossil fuel era!!
– Renewable sources: wind, hydropower,
biomass, geothermal
Sources of Energy
Sources of Energy
Sources of Energy
Sources of Energy
Energy Consumption
Energy Consumption
Energy Consumption
Energy Consumption
Energy Consumption
Evaluating Energy Resources
• Supplies
• Environmental impact
• Amount of useful energy provided
Evaluating Energy Resources
• Any energy resource with a low net energy
will need government subsidies to
compete in the marketplace with high net
energy resources.
Fossil Fuels
• Dominant source of power!!
• High energy content
• Efficient to burn, ship and store
Fossil Fuels
Fossil Fuels
Fossil Fuels
Unevenly Distributed!!
0.00
5.00
10.00
15.00
20.00
25.00
30.00
35.00
% of World Reserves
Coal
Oil
Natural Gas
Fossil Fuel Type
US
Saudi Arabia
Russian Federation
Iraq
Fossil Fuels
Per capita consumption varies!!
Developed countries use more than developing countries!!
Fossil Fuels
Different profiles of energy use!!
OECD = Organization for Economic Cooperation and Development
Mainly Developed Nations
Mainly Developing Nations
Fossil Fuels
Decreasingly available!!
0
100
200
300
Coal
Natural
Gas
Oil
Estimated Reserves (yrs)
Fossil Fuel Formation
Coal
• Most abundant fossil fuel
• Organic matter (generally woody plant
material) compressed under very high
pressure to form dense, solid carbon
structures
• Burned in 2100 power plants, generates
40% of the world’s electricity
Coal
Coal
Coal
Coal
• Three largest coal-burning countries
– China
– United States
– Canada
Coal
Coal
Strip Mining
Coal
Coal
Severe air pollution!!
• Sulfur released as
SO2
• Large amount of soot
• CO2
• Trace amounts of Hg
and radioactive
materials
Coal
• Single biggest air polluter in coal-burning
countries
• One-fourth of the annual CO2 emissions
• Many opposed to new coal-burning power
plants!!
• Environmentalists call for
– Taxation on carbon dioxide production by
power plants.
– Cleaner coal-burning plants.
CO2 Emissions Per Unit of Electrical Energy
Produced for Energy Sources, expressed as % of
emissions released by burning coal directly
Coal
• Conversion of solid coal to
– Synthetic natural gas (SNG) by coal
gasification
– Methanol or synthetic gasoline by coal
liquefaction
• Are there benefits to using these synthetic
fuels?
Oil
• Also known as crude oil, conventional oil,
light oil or petroleum
• Most used fuel since the 1960s
• Accounts for ca. 40% of the world’s
commercial energy consumption
Oil
Petrochemicals:
products of oil
distillation
Oil
Saudi Arabia
13.1
Russia 11.9
USA 8.5
Iran 5.2
Mexico 4.9
China 4.5
Venezuela 4.0
Canada 3.8
Norway 3.9
UAE 3.3
USA 24.9
China 8.6
Japan 6.4
Russia 3.4
Germany 3.3
India 3.2
S. Korea 2.8
Canada 2.6
France 2.5
Italy 2.4
Oil
• 13 countries have at least 60% of the
world’s crude oil reserves
– Saudi Arabia: 25%
– Canada: 15%
Oil
Oil
• Organization of Petroleum Exporting
Countries (OPEC) controls oil prices!
Oil
Oil
• Possible effects of steeply rising oil prices
– Reduce energy waste
– Shift to non-carbon energy sources
– Higher prices for products made with
petrochemicals
– Higher food prices; buy locally-produced food
– Airfares higher
– Smaller more fuel-efficient vehicles
– Upgrade of public transportation
Oil
Oil Spills