
CSC 423 Chapter 26, Fall 2011
Notre Dame University–Louaize · Software Engineering · 31 pages · Dr. Maya Samaha



Showing the first 10 of 31 pages. Download the PDF to see all of it.
More CSC 423 files
Show the text of this chapter
1
Chapter 26
Estimation for Software Projects
2
Software Project Planning
The overall goal of project planning is to
The overall goal of project planning is to
establish a pragmatic strategy for controlling,
establish a pragmatic strategy for controlling,
tracking, and monitoring a complex technical
tracking, and monitoring a complex technical
project.
project.
Why?
Why?
So the end result gets done on time, with quality!
So the end result gets done on time, with quality!
3
Project Planning Task Set-I
Establish project scope
Determine feasibility
Analyze risks
Risk analysis is considered in detail in Chapter 28.
Define required resources
Determine require human resources
Define reusable software resources
Identify environmental resources
4
Project Planning Task Set-II
Estimate cost and effort
Decompose the problem
Develop two or more estimates using size, function
points, or process tasks
Reconcile the estimates
Develop a project schedule
Scheduling is considered in detail in Chapter 27.
• Establish a meaningful task set
• Define a task network
• Use scheduling tools to develop a timeline chart
• Define schedule tracking mechanisms
5
Estimation
Estimation of resources, cost, and schedule for
a software engineering effort requires
experience
access to good historical information (metrics)
the courage to commit to quantitative predictions
when qualitative information is all that exists
Estimation carries inherent risk and this risk
leads to uncertainty
6
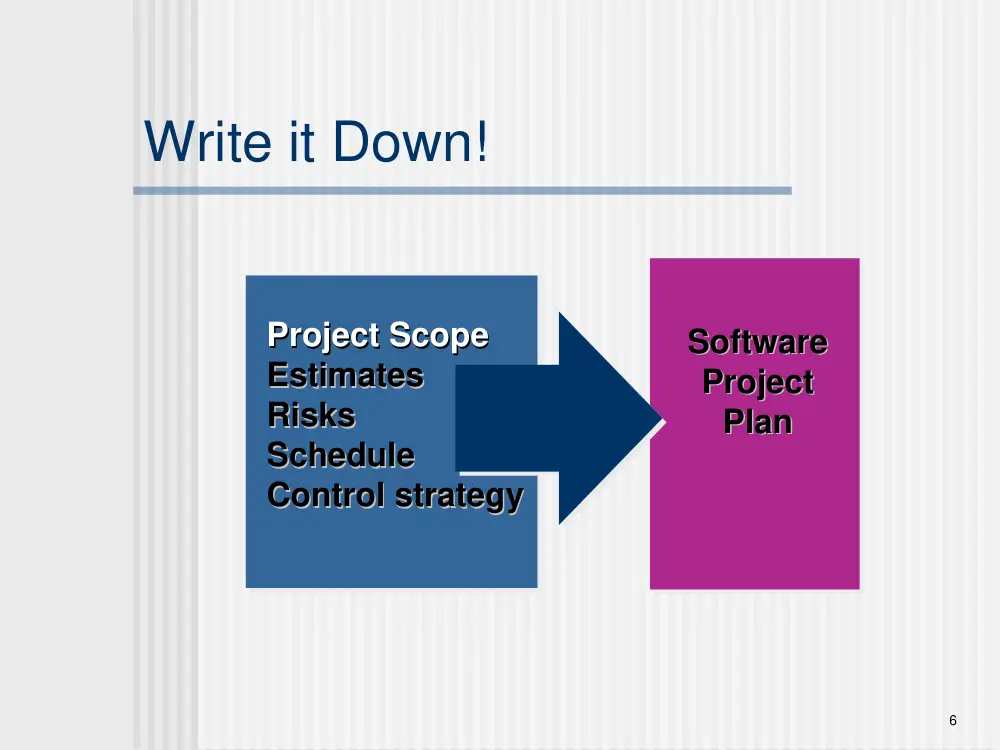
Write it Down!
Software
Software
Project
Project
Plan
Plan
Project Scope
Project Scope
Estimates
Estimates
Risks
Risks
Schedule
Schedule
Control strategy
Control strategy
7
To Understand Scope ...
Understand the customers needs
understand the business context
understand the project boundaries
understand the customer’s motivation
understand the likely paths for change
understand that ...
Even when you understand,
Even when you understand,
nothing is guaranteed!
nothing is guaranteed!
8
What is Scope?
Software scope describes
the functions and features that are to be delivered to
end-users
the data that are input and output
the “content” that is presented to users as a
consequence of using the software
the performance, constraints, interfaces, and
reliability that bound the system.
Scope is defined using one of two techniques:
• A narrative description of software scope is developed
after communication with all stakeholders.
• A set of use-cases is developed by end-users.
9
Resources
project
people
skills
number
location
reusable
software
OTS
components
full-experience
components
new
components
part.-experience
components
environment
hardware
software
tools
network
resources
10
Project Estimation
Project scope must be
understood
Elaboration (decomposition) is
necessary
Historical metrics are very
helpful
At least two different techniques
should be used
Uncertainty is inherent in the
process
11
Estimation Techniques
Past (similar) project experience
Conventional estimation techniques
task breakdown and effort estimates
size (e.g., FP) estimates
Empirical models
12
Function Points
Information
Domain Value
Count
simple average complex
Weighting factor
External Inputs ( EIs)
External Outputs ( EOs)
External Inquiries ( EQs)
Internal Logical Files ( ILFs)
External Interface Files ( EIFs)
3
4
6
4
5
7
3
4
6
7
10
15
5
7
10
=
=
=
=
=
Count total
3
3
3
3
3
13
Estimation Accuracy
Predicated on …
the degree to which the planner has properly
estimated the size of the product to be built
the ability to translate the size estimate into human
effort, calendar time, and dollars (a function of the
availability of reliable software metrics from past
projects)
the degree to which the project plan reflects the
abilities of the software team
the stability of product requirements and the
environment that supports the software engineering
effort.
14
Functional Decomposition
functional
functional
decomposition
decomposition
Statement
Statement
of
of
Scope
Scope
15
Conventional Methods:
LOC/FP Approach
compute LOC/FP using estimates of
information domain values
use historical data to build estimates for
the project
An expected value can be computed as a
weighted average of the optimistic (sopt,
most likely (sm), and pessimistic (spess)
estimates.
For example: S= (sopt + sm + spess )/6
16
Example: LOC Approach
Average productivity for systems of this type = 620 LOC/pm.
Average productivity for systems of this type = 620 LOC/pm.
Burdened labor rate =$8000 per month, the cost per line of
Burdened labor rate =$8000 per month, the cost per line of
code is approximately $13.
code is approximately $13.
Based on the LOC estimate and the historical productivity
Based on the LOC estimate and the historical productivity
data, the total estimated project cost is
data, the total estimated project cost is $431,000 and the
estimated effort is 54 person-months.
17
Function-Based Metrics
The function point metric (FP), first proposed by Albrecht [ALB79], can
be used effectively as a means for measuring the functionality
delivered by a system.
Function points are derived using an empirical relationship based on
countable (direct) measures of software's information domain and
assessments of software complexity
Information domain values are defined in the following manner:
number of external inputs (EIs)
number of external outputs (EOs)
number of external inquiries (EQs)
number of internal logical files (ILFs)
Number of external interface files (EIFs)
18
Function Point Estimation Worksheet
Complexity
Description
Low
Medium
High
Total
Inputs
___ x 3
___ x 4
___ x 6
___
Outputs
___ x 4
___ x 5
___ x 7
___
Queries
___ x 3
___ x 4
___ x 6
___
Files
___ x 7
___ x 10
___ x 15
___
Program Interfaces
___ x 5
___ x 7
___ x 10
___
0-5
Data communications
___
Heavily use configuration
___
Transaction rate
___
End-user efficiency
___
Complex processing
___
Installation ease
___
Multiple sites
___
Performance
___
Distributed functions
___
On-line data entry
___
On-line update
___
Reusability
___
Operational ease
___
Extensibility
___
Total Unadjusted Function Points (TUFP): _______________
(0=no effect on processing complexity; 5=great effect
on processing complexity)
Count Total:|__________
FP = count-total
FP = count-total ** [0.65 + 0.01*
[0.65 + 0.01*SS (F
(Fii)])]
SS (F
(Fii)]:___
)]:___
19
Example: FP Approach
The estimated number of FP is derived:
The estimated number of FP is derived:
FP
FPestimated
estimated = count-total
= count-total ** [0.65 + 0.01
[0.65 + 0.01 33 SS (F
(Fii)])]
FP
FPestimated
estimated = 375
= 375
organizational average productivity = 6.5 FP/pm.
organizational average productivity = 6.5 FP/pm.
burdened labor rate = $8000 per month, approximately $1230/FP.
burdened labor rate = $8000 per month, approximately $1230/FP.
Based on the FP estimate and the historical productivity data,
Based on the FP estimate and the historical productivity data, total estimated
project cost is $461,000 and estimated effort is 58 person-months.
20
Process-Based Estimation
Obtained from “process framework”
Obtained from “process framework”
application
functions
framework activities
framework activities
Effort required to
accomplish
each framework
activity for each
application function
21
Process-Based Estimation Example
Activity
Task
Function
UICF
2DGA
3DGA
DSM
PCF
CGDF
DAM
Totals
% effort
CC
Planning
Risk
Analysis
Engineering
Construction
Release
Totals
CE
analysis
design
code
test
0.25
0.25
0.25
3.50
20.50
4.50
16.50
46.00
1%
1%
1%
8%
45%
10%
36%
CC = customer communication CE = customer evaluation
0.50
0.75
0.50
0.50
0.50
0.25
2.50
4.00
4.00
3.00
3.00
2.00
0.40
0.60
1.00
1.00
0.75
0.50
5.00
2.00
3.00
1.50
1.50
1.50
8.40
7.35
8.50
6.00
5.75
4.25
0.50
2.00
0.50
2.00
5.00
n/a
n/a
n/a
n/a
n/a
n/a
n/a
Based on an average burdened labor rate of $8,000 per
Based on an average burdened labor rate of $8,000 per
month,
month, the total estimated project cost is $368,000 and the
estimated effort is 46 person-months.
22
Empirical Estimation Models
General form:
General form:
effort = tuning coefficient * size
exponent
usually derived
usually derived
as person-months
as person-months
of effort required
of effort required
either a constant or
either a constant or
a number derived based
a number derived based
on complexity of project
on complexity of project
usually LOC but
usually LOC but
may also be
may also be
function point
function point
empirically
empirically
derived
derived
23
COCOMO-II
COCOMO II is actually a hierarchy of
estimation models that address the following
areas:
• Application composition model. Used during the early
stages of software engineering, when prototyping of
user interfaces, consideration of software and system
interaction, assessment of performance, and
evaluation of technology maturity are paramount.
• Early design stage model. Used once requirements
have been stabilized and basic software architecture
has been established.
• Post-architecture-stage model. Used during the
construction of the software.
24
The Software Equation
A dynamic multivariable model
A dynamic multivariable model
E = [LOC x B
E = [LOC x B0.333
0.333/P]
/P]33 x (1/t
x (1/t44))
where
where
E = effort in person-months or person-years
E = effort in person-months or person-years
t = project duration in months or years
t = project duration in months or years
B = “special skills factor”
B = “special skills factor”
P = “productivity parameter”
P = “productivity parameter”
25
B Value
Size of
Project
.16
5-15K
.18
20K
.28
30K
.34
40K
.37
50K
.39
>70K
P Value
Description
2,000
Real time
embedded
software
10,000
Telecommunic
ations
software
12,000
Scientific
software
28,000
Business
system
applications
To simplify the estimation
process:
26
Minimum development time=8.14*(LOC/p)0.43
for tmin >6 months
E= 180*B*t3 in person months for E> 20 pm
t is in years
27
Estimation for OO Projects-I
Develop estimates using effort decomposition, FP analysis,
and any other method that is applicable for conventional
applications.
Using object-oriented requirements modeling (Chapter 6),
develop use-cases and determine a count.
From the analysis model, determine the number of key classes
(called analysis classes in Chapter 6).
Categorize the type of interface for the application and develop
a multiplier for support classes:
Interface type
Multiplier
No GUI
2.0
Text-based user interface
2.25
GUI
2.5
Complex GUI
3.0
28
Estimation for OO Projects-II
Multiply the number of key classes (step 3) by the
multiplier to obtain an estimate for the number of support
classes.
Multiply the total number of classes (key + support) by
the average number of work-units per class. Lorenz and
Kidd suggest 15 to 20 person-days per class.
Cross check the class-based estimate by multiplying the
average number of work-units per use-case
29
Estimation for Agile Projects
Each user scenario (a mini-use-case) is considered separately
for estimation purposes.
The scenario is decomposed into the set of software
engineering tasks that will be required to develop it.
Each task is estimated separately. Note: estimation can be
based on historical data, an empirical model, or “experience.”
Alternatively, the ‘volume’ of the scenario can be estimated in LOC,
FP or some other volume-oriented measure (e.g., use-case count).
Estimates for each task are summed to create an estimate for
the scenario.
Alternatively, the volume estimate for the scenario is translated into
effort using historical data.
The effort estimates for all scenarios that are to be implemented
for a given software increment are summed to develop the effort
estimate for the increment.
30
The Make-Buy Decision
system X
system X
reuse
reuse
simple (0.30)
simple (0.30)
difficult (0.70)
difficult (0.70)
minor
minor changes
changes
(0.40)
(0.40)
major
major
changes
changes
(0.60)
(0.60)
simple (0.20)
simple (0.20)
complex (0.80)
complex (0.80)
major
major changes
changes (0.30)
(0.30)
minor
minor changes
changes
(0.70)
(0.70)
$380,000
$380,000
$450,000
$450,000
$275,000
$275,000
$310,000
$310,000
$490,000
$490,000
$210,000
$210,000
$400,000
$400,000
buy
buy
contract
contract
without changes (0.60)
without changes (0.60)
with changes (0.40)
with changes (0.40)
$350,000
$350,000
$500,000
$500,000
build
build
31
Computing Expected Cost
(path probability)
(path probability) x (estimated path cost)
(estimated path cost)
ii
ii
For example, the expected cost to build is:
For example, the expected cost to build is:
expected cost = 0.30 ($380K) + 0.70 ($450K)
expected cost = 0.30 ($380K) + 0.70 ($450K)
similarly,
similarly,
expected cost = $382K
expected cost = $267K
expected cost = $410K
build
build
reuse
buy
contr
expected cost =
= $429 K
= $429 K