
BUSS 230 Midterm, Spring 2002
American University of Beirut · Managerial Economics · 6 pages

More BUSS 230 files
- Midterm · Fall 2013ExamView
- Midterm Solution · Fall 2013Exam · with solutionView
- Midterm Review Questions Solution · Fall 2011Exam · with solutionView
- Midterm Review Questions · Fall 2011ExamView
- Midterm · Fall 2006ExamView
- Midterm · Spring 2005ExamView
- Midterm · Fall 2005ExamView
- Midterm · Spring 2004ExamView
Show the text of this exam
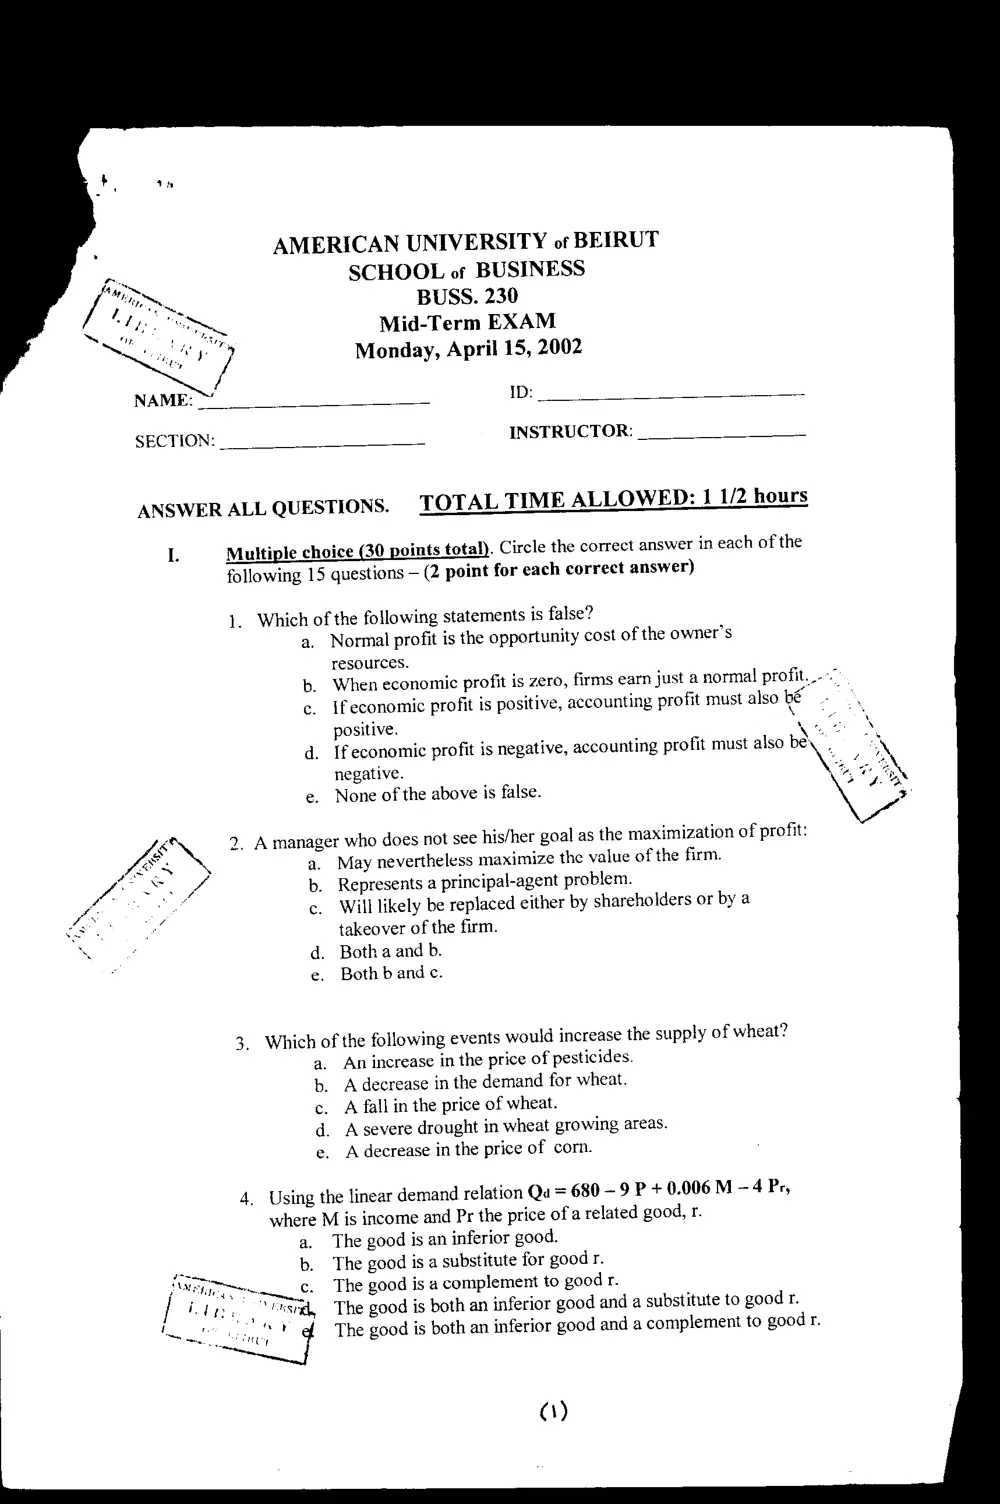
AMERICAN UNIVERSITY of BEIRUT
SCHOOL of BUSINESS
BUSS. 230
Mid-Term EXAM
Monday, April 15, 2002
ID:
INSTRUCTOR:
SECTION:
ANSWER ALL QUESTIONS. TOTAL TIME ALLOWED: 1 1/2 hours
L Multiple choice (30 points total). Circle the correct answer in each of the
following 15 questions — (2 point for each correct answer)
1. Which of the following statements is false?
a. Normal profit is the opportunity cost of the owner’s
resources.
b. When economic profit is zero, firms earn just a normal profit...
c. Ifeconomic profit is positive, accounting profit must also be
positive.
d. Ifeconomic profit is negative, accounting profit must also bes °
negative.
e. None of the above is false.
A™. 2. A manager who does not see his/her goal as the maximization of profit:
ws a. May nevertheless maximize the value of the firm.
/ b. Represents a principal-agent problem.
c. Will likely be replaced either by shareholders or by a
takeover of the firm.
‘\ ; ° d. Botha and b.
, e. Bothbandc.
Which of the following events would increase the supply of wheat?
An increase in the price of pesticides.
A decrease in the demand for wheat.
A fall in the price of wheat.
A severe drought in wheat growing areas.
A decrease in the price of corn.
ww
soo SP
4. Using the linear demand relation Qu = 680 -9 P + 0.006 M — 4 Pr,
where M is income and Pr the price of a related good, r.
a. The good is an inferior good.
pe. b. The good is a substitute for good r.
; WE CH The good is a complement to good r.
The good is both an inferior good and a substitute to good r.
The good is both an inferior good and a complement to good r.
Q)
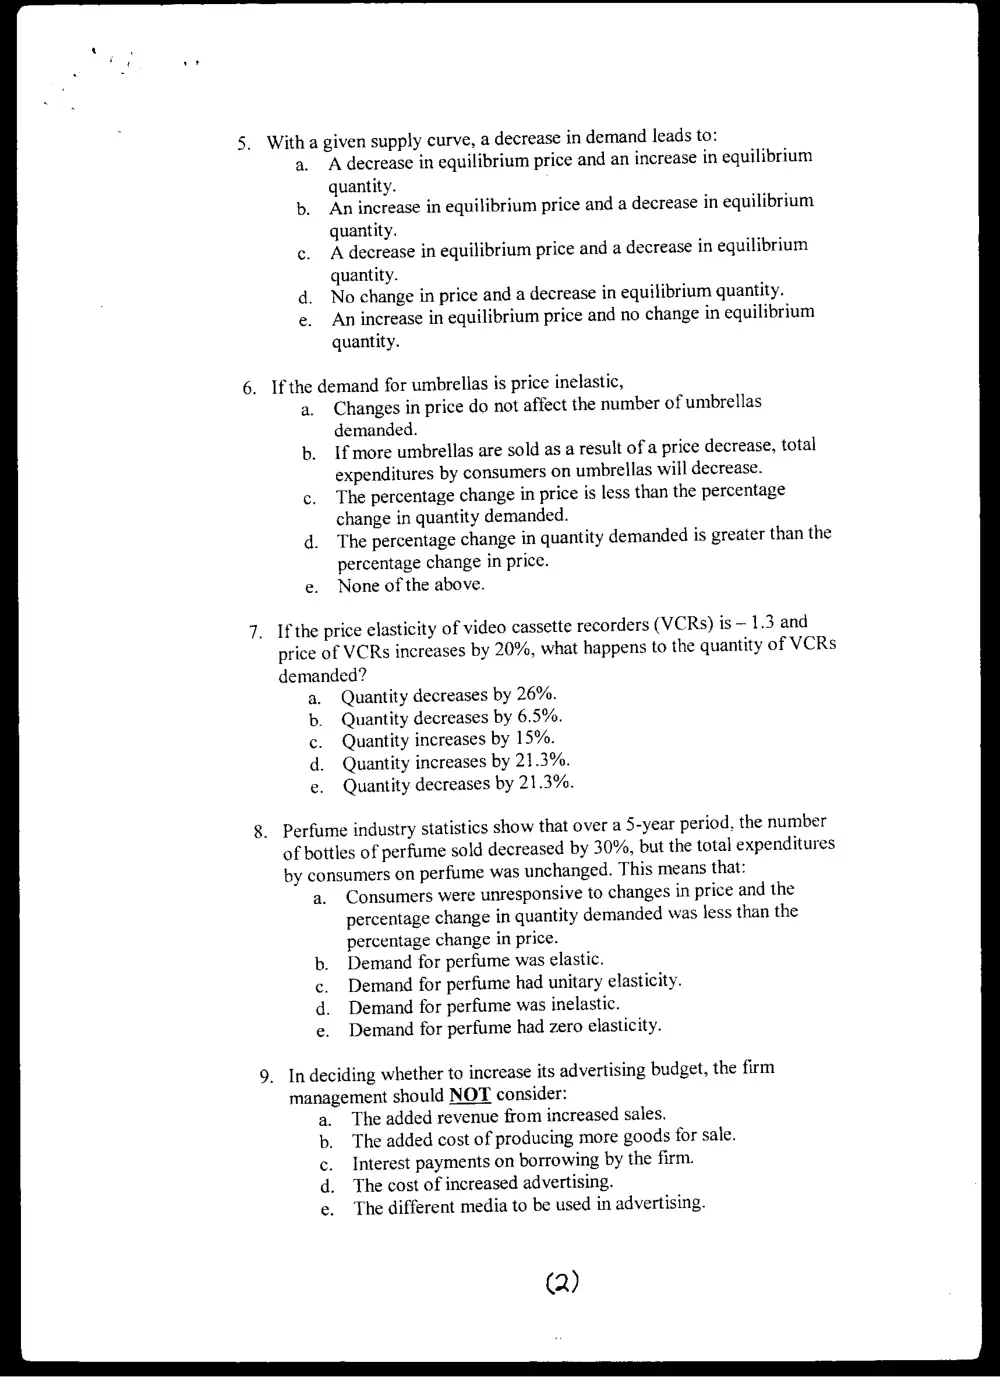
5. Witha given supply curve, a decrease in demand leads to:
a. A decrease in equilibrium price and an increase in equilibrium
quantity. ;
b. An increase in equilibrium price and a decrease in equilibrium
quantity.
A decrease in equilibrium price and a decrease in equilibrium
quantity.
No change in price and a decrease in equilibrium quantity.
An increase in equilibrium price and no change in equilibrium
quantity.
6. Ifthe demand for umbrellas is price inelastic,
a. Changes in price do not affect the number of umbrellas
demanded.
b. If more umbrellas are sold as a result of a price decrease, total
expenditures by consumers on umbrellas will decrease.
c. The percentage change in price is less than the percentage
change in quantity demanded.
d. The percentage change in quantity demanded is greater than the
percentage change in price.
e. None of the above.
7. Ifthe price elasticity of video cassette recorders (VCRs) is — 1.3 and
price of VCRs increases by 20%, what happens to the quantity of VCRs
demanded?
a. Quantity decreases by 26%.
b. Quantity decreases by 6.5%.
c. Quantity increases by 15%.
d. Quantity increases by 21.3%.
e. Quantity decreases by 21.3%.
8. Perfume industry statistics show that over a 5-year period, the number
of bottles of perfume sold decreased by 30%, but the total expenditures
by consumers on perfume was unchanged. This means that:
a. Consumers were unresponsive to changes in price and the
percentage change in quantity demanded was less than the
percentage change in price.
Demand for perfume was elastic.
Demand for perfume had unitary elasticity.
Demand for perfume was inelastic.
Demand for perfume had zero elasticity.
9. In deciding whether to increase its advertising budget, the firm
management should NOT consider:
The added revenue from increased sales.
The added cost of producing more goods for sale.
Interest payments on borrowing by the firm.
The cost of increased advertising.
The different media to be used in advertising.
(2)
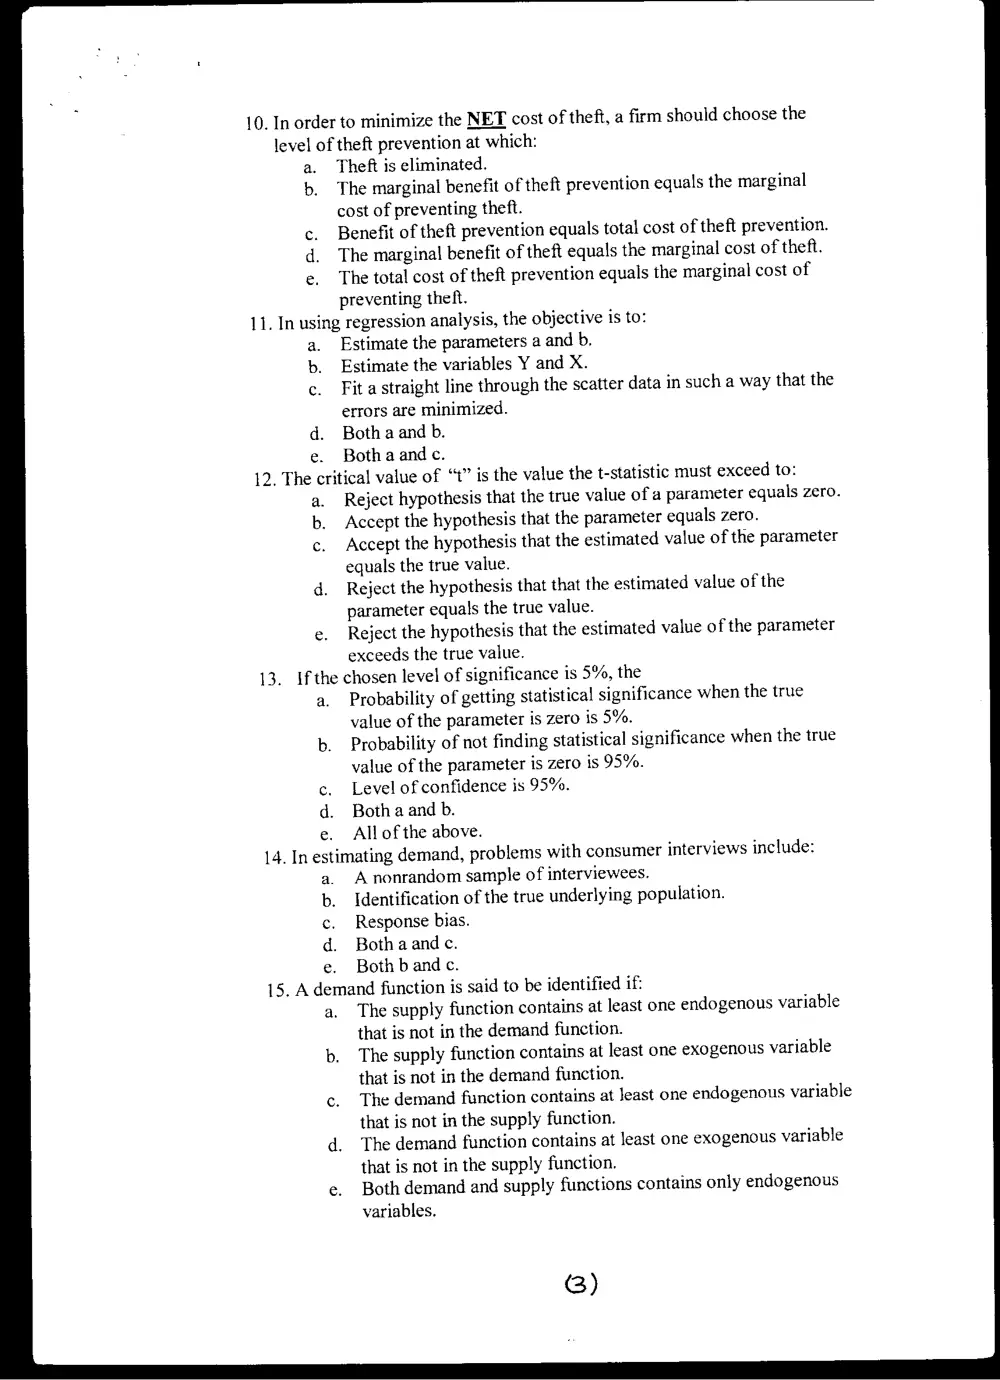
10. In order to minimize the NET cost of theft, a firm should choose the
level of theft prevention at which:
a. Theft is eliminated.
b. The marginal benefit of theft prevention equals the marginal
cost of preventing theft.
c. Benefit of theft prevention equals total cost of theft prevention.
d. The marginal benefit of theft equals the marginal cost of theft.
e. The total cost of theft prevention equals the marginal cost of
preventing theft.
11. In using regression analysis, the objective is to:
a. Estimate the parameters a and b.
b. Estimate the variables Y and X.
c. Fit astraight line through the scatter data in such a way that the
errors are minimized.
d. Bothaand b.
e. Bothaandc.
12. The critical value of “t” is the value the t-statistic must exceed to:
a. Reject hypothesis that the true value of a parameter equals zero.
b. Accept the hypothesis that the parameter equals zero.
c. Accept the hypothesis that the estimated value of the parameter
equals the true value.
d. Reject the hypothesis that that the estimated value of the
parameter equals the true value.
e. Reject the hypothesis that the estimated value of the parameter
exceeds the true value.
13. Ifthe chosen level of significance is 5%, the
a. Probability of getting statistical significance when the true
value of the parameter is zero is 5%.
b. Probability of not finding statistical significance when the true
value of the parameter is zero is 95%.
c. Level of confidence is 95%.
d. Botha and b.
e. Allofthe above.
14. In estimating demand, problems with consumer interviews include:
a. A nonrandom sample of interviewees.
b. Identification of the true underlying population.
c. Response bias.
d. Bothaandc.
e. Bothbandc.
15. A demand function is said to be identified if:
a. The supply function contains at least one endogenous variable
that is not in the demand function.
b. The supply function contains at least one exogenous variable
that is not in the demand function.
The demand function contains at least one endogenous variable
that is not in the supply function.
The demand function contains at least one exogenous variable
that is not in the supply function.
Both demand and supply functions contains only endogenous
variables.
GB)
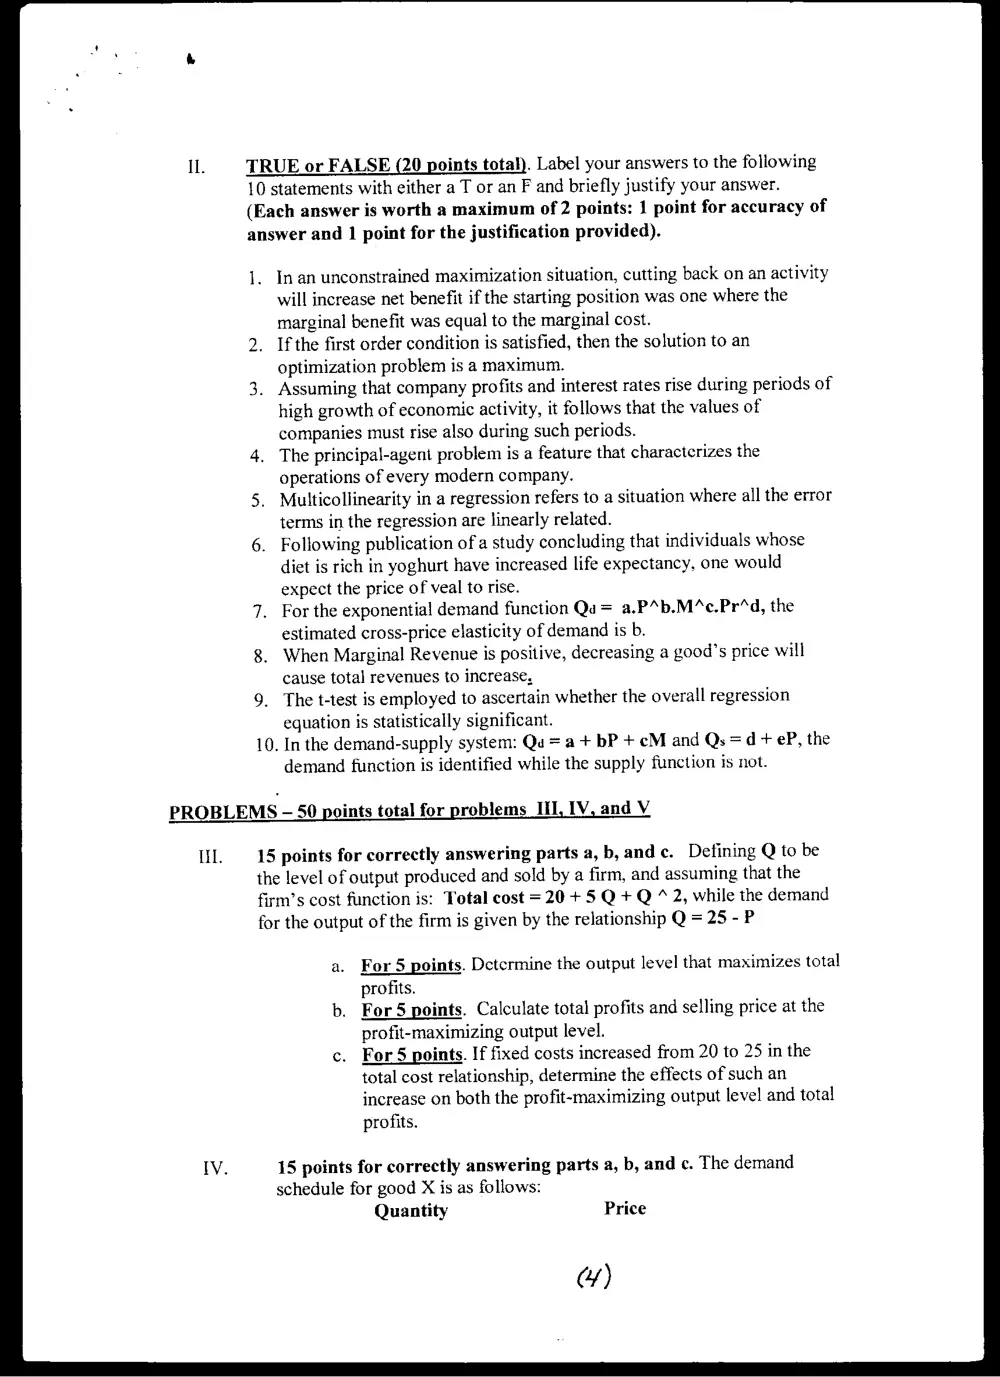
TRUE or FALSE (20 points total). Label your answers to the following
10 statements with either a T or an F and briefly justify your answer.
(Each answer is worth a maximum of 2 points: 1 point for accuracy of
answer and 1 point for the justification provided).
1. Inan unconstrained maximization situation, cutting back on an activity
will increase net benefit if the starting position was one where the
marginal benefit was equal to the marginal cost.
. Ifthe first order condition is satisfied, then the solution to an
optimization problem is a maximum.
. Assuming that company profits and interest rates rise during periods of
high growth of economic activity, it follows that the values of
companies must rise also during such periods.
. The principal-agent problem is a feature that characterizes the
operations of every modern company.
. Multicollinearity in a regression refers to a situation where all the error
terms in the regression are linearly related.
Following publication of a study concluding that individuals whose
diet is rich in yoghurt have increased life expectancy, one would
expect the price of veal to rise.
For the exponential demand function Qu = a.P’b.M‘’c.Pr‘“d, the
estimated cross-price elasticity of demand is b.
When Marginal Revenue is positive, decreasing a good’s price will
cause total revenues to increase,
9. The t-test is employed to ascertain whether the overall regression
equation is statistically significant.
10. In the demand-supply system: Qu = a + bP + cM and Qs =d + eP, the
demand function is identified while the supply function is not.
PROBLEMS -— 50 points total for problems Ii], TV, and V
Ill. 15 points for correctly answering parts a, b, and c. Defining Q to be
the level of output produced and sold by a firm, and assuming that the
firm’s cost function is: Total cost = 20 + 5 Q + Q * 2, while the demand
for the output of the firm is given by the relationship Q = 25 - P
a. For 5 points. Detcrmine the output level that maximizes total
profits.
b. ForS points. Calculate total profits and selling price at the
profit-maximizing output level.
For 5 points. If fixed costs increased from 20 to 25 in the
total cost relationship, determine the effects of such an
increase on both the profit-maximizing output level and total
profits.
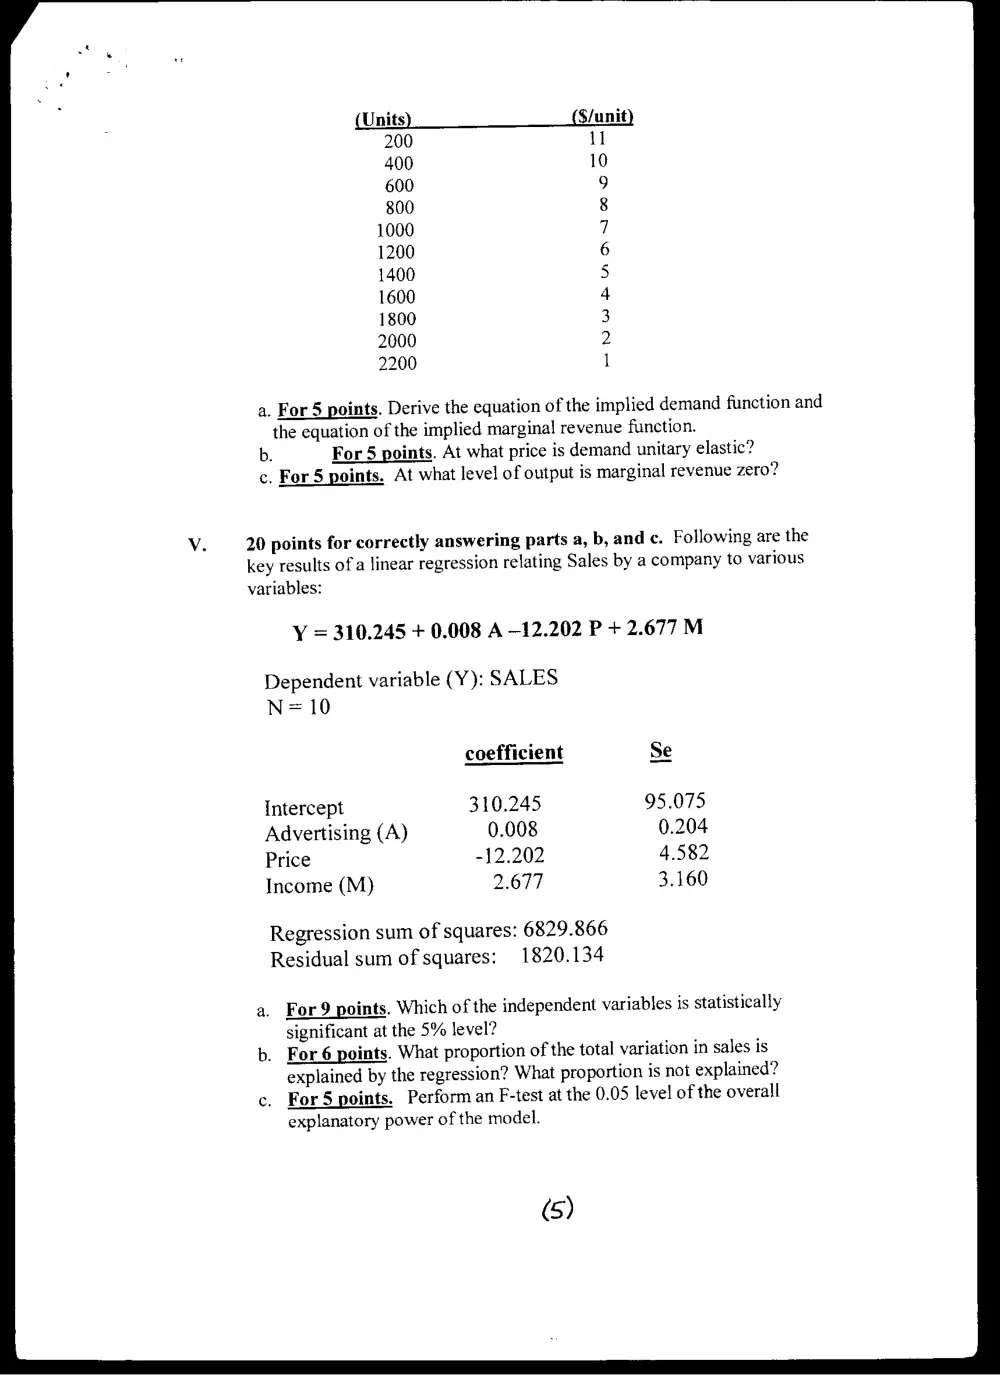
15 points for correctly answering parts a, b, and c. The demand
schedule for good X is as follows:
Quantity Price
(4)
200
400
600
800
1000
1200
1400
1600
1800
2000
2200
BENWHRUAD~IOO
a. For 5 points. Derive the equation of the implied demand function and
the equation of the implied marginal revenue function.
b. For 5 points. At what price is demand unitary elastic?
c. For 5 points. At what level of output is marginal revenue zero?
Vv. 20 points for correctly answering parts a, b, and c. Following are the
key results of a linear regression relating Sales by a company to various
variables:
Y = 310.245 + 0.008 A -12.202 P + 2.677 M
Dependent variable (Y): SALES
N= 10
coefficient
Intercept 310.245
Advertising (A) 0.008
Price -12.202
Income (M) 2.677
Regression sum of squares: 6829.866
Residual sum of squares: 1820.134
a. For 9 points. Which of the independent variables is statistically
significant at the 5% level?
b. For 6 points. What proportion of the total variation in sales is
explained by the regression? What proportion is not explained?
c. ForS points, Perform an F-test at the 0.05 level of the overall
explanatory power of the model.
(5)
APPENDIX _ Statistical Tables 725
Critical *-Values Degrees of Significance level
freedom 0.10 0.05 0.02 0.01
| 6.314 12.706 31.82) 63.657
2.920 4.303 6.965 9.925
2.353 3.182 4.54) 5.84}
2.132 2.776 3.747 4.604
2.015 2.57) 3.365 4.032
1.943 2.447 3.143 3.707
1,895 2.365 2.998 3.499
1.860 2.306 2.895 3.355
1 833 2.262 . 282) 3.256
1.812 2 228 2.764 3.169
7% 2291 2718 3108
782 2179 2 681 3.055
77) 2 160 2 659 301?
761 2 445 2.624 2.977
753 2.131 2.602 2.947
746 2120 2.583 2.921
7A0 2.110 2.56? 2.898
734 2101 2.552 2.878
729 2.093 2.539 2.86)
725 2 C86 2.528 2.845
72\ 2.080 2.518 2 831
717 2.074 2819
714 2059 $00 2.807
V711 2094 242 2797
708 2 BOF 4 2.787
706 2056 2.47 2.779
703 2.47 2.77)
701 Cas 24 2762
699 5 2 4 2753
697 y Z 5) 2.759
684 2.704
671 x \ 2.660
658 < 2617
645 2.576
Source: Adapted with permission from R | Werracot and TH Worracet, f:esometics, 2d ed, New York toha Wiley
& Sons, 1979.
(6)