
BUSS 230 Midterm, Spring 2003
American University of Beirut · Managerial Economics · 8 pages




More BUSS 230 files
- Midterm · Fall 2013ExamView
- Midterm Solution · Fall 2013Exam · with solutionView
- Midterm Review Questions Solution · Fall 2011Exam · with solutionView
- Midterm Review Questions · Fall 2011ExamView
- Midterm · Fall 2006ExamView
- Midterm · Spring 2005ExamView
- Midterm · Fall 2005ExamView
- Midterm · Spring 2004ExamView
Show the text of this exam
AMERICAN UNIVERSITY of BEIRUT
SCHOOL ot BUSINESS
BUSS. 230
Mid-Term EXAM
Monday, April 7, 2003
NAME: ID:
SECTION: INSTRUCTOR:
ANSWER ALL QUESTIONS. TOTAL TIME ALLOWED: 1 1/2 hours
1. Multiple choice (30 points total). Circle the correct answer in each of the
following 15 questions — (2 point for each correct answer)
1. The tendency of managers to operate a firm in a way that maximizes
their personal utility rather than the firm’s profits is referred to as:
. Personal wealth incentive.
. Principal-agent problem.
. Hidden agenda scenario.
. Maximization of managerial profits incentive.
. Executive utility incentive.
2. Which of the following is an example of implicit costs?
. Dividends paid to shareholders.
. Uncompensated services by the wife of a firm’s owner.
. Wages of unproductive workers.
. Bribes paid to win new business for the firm.
. Fringe benefits awarded to top managers of the firm.
3. Assume that a firm’s total revenue function has been estimated as TR =
200Q -20 Q’2. What would be the firm’s average revenue when one
unit of output is produced?
180.
160.
- 20.
~ 200.
220.
4. Ifa firm’s marginal revenue from sales is equal to zero, then:
Total revenue is zero.
Average revenue is zero.
Total revenue is at a maximum.
Average revenue is at a maximum.
Total profits are at a maximum.
-|-
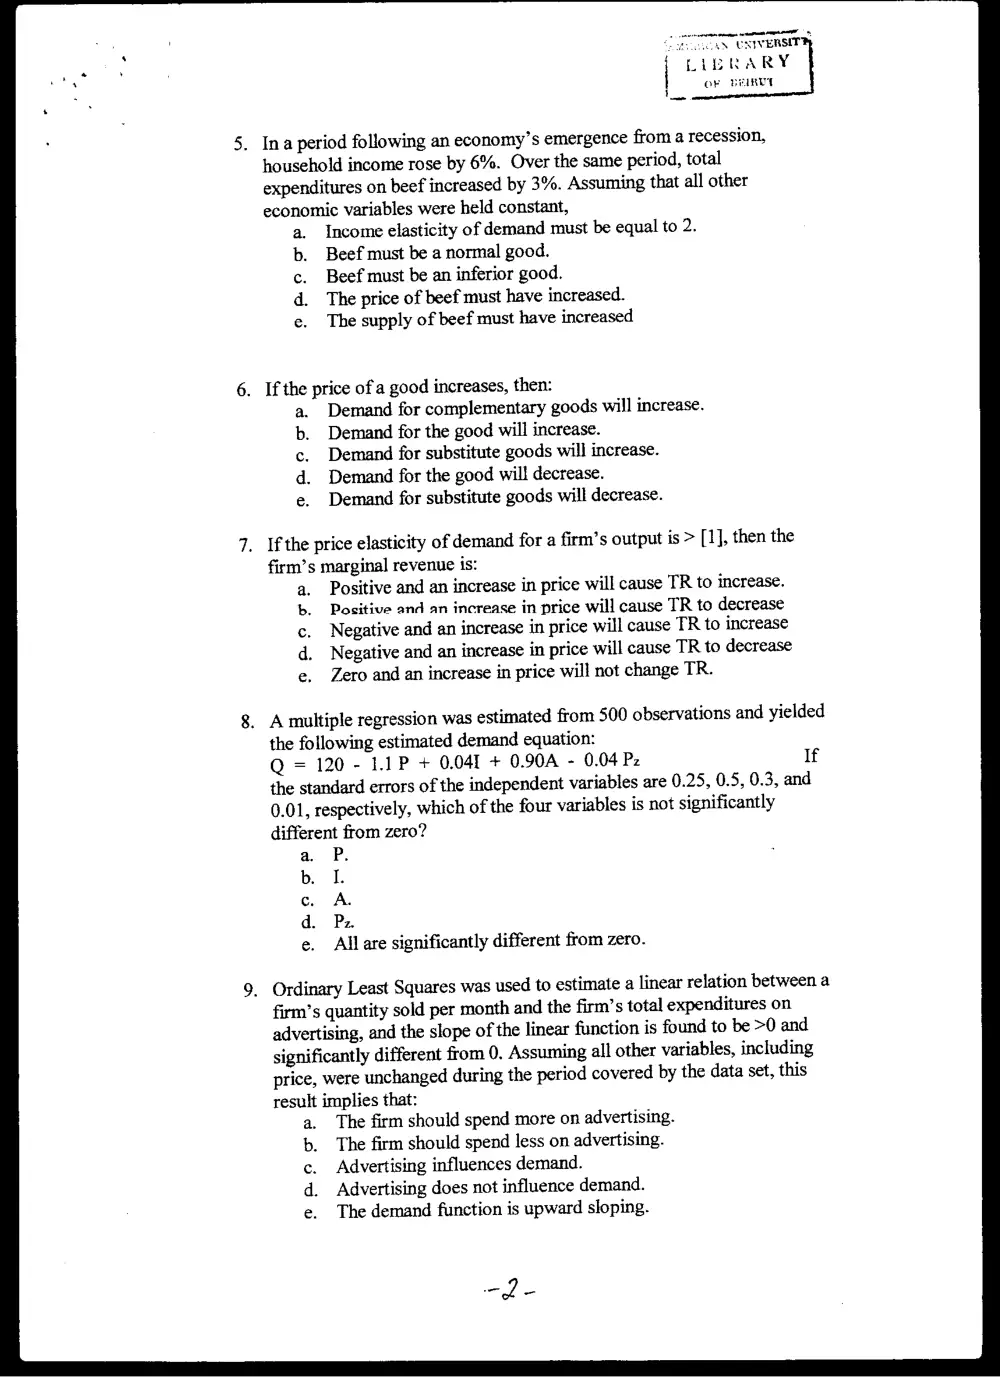
. Ina period following an economy’s emergence from a recession,
household income rose by 6%. Over the same period, total
expenditures on beef increased by 3%. Assuming that all other
economic variables were held constant,
Income elasticity of demand must be equal to 2.
Beef must be a normal good.
Beef must be an inferior good.
The price of beef must have increased.
The supply of beef must have increased
. If the price of a good increases, then:
Demand for complementary goods will increase.
Demand for the good will increase.
Demand for substitute goods will increase.
Demand for the good will decrease.
Demand for substitute goods will decrease.
. Ifthe price elasticity of demand for a firm’s output is > [1], then the
firm’s marginal revenue is:
Positive and an increase in price will cause TR to increase.
Positive and an increase in price will cause TR to decrease
Negative and an increase in price will cause TR to increase
Negative and an increase in price will cause TR to decrease
Zero and an increase in price will not change TR.
. A multiple regression was estimated from 500 observations and yielded
the following estimated demand equation:
Q = 120-1.1P + 0.041 + 0.90A - 0.04 Pz If
the standard errors of the independent variables are 0.25, 0.5, 0.3, and
0.01, respectively, which of the four variables is not significantly
different from zero?
a. P.
b. I.
c A.
d. Pz.
e. Allare significantly different from zero.
. Ordinary Least Squares was used to estimate a linear relation between a
firm’s quantity sold per month and the firm’s total expenditures on
advertising, and the slope of the linear function is found to be >0 and
significantly different from 0. Assuming all other variables, including
price, were unchanged during the period covered by the data set, this
result implies that:
The firm should spend more on advertising.
The firm should spend less on advertising.
Advertising influences demand.
Advertising does not influence demand.
The demand function is upward sloping.
-2-
[ene eee,
in MEBICAN CNEVERSIT
LIBLARY
OF BEIRUT
10. Heteroscedasticity refers to a situation where the error terms from a
regression:
epee rp
Do not have equal variance.
Are not normally distributed.
Do not have a mean of zero.
Are all positive.
All of the above are correct.
11. The forecast level of sales for the month of October was 140 units.
Actual sales in October turned out to be 130 units. Using an exponential
smoothing coefficient of 0.6, the forecast for sales in November would
be:
geno SP
146.
140.
138
134.
130.
12. Which of the following is NOT a qualitative forecasting technique?
eao op
Surveys of consumer expenditure plans.
Consumer intention polling.
Soliciting the views of sales representatives
Index of buying intentions of purchasing managers
Time-series analysis
13. Econometric forecasts require:
a.
db.
c.
d.
e.
‘Accurate estimates of the coefficients of structural equations
Appropriate theoretical models.
Forecasts of future values of exogenous variables.
Correcting for autocorrelation, multicollinearity, and
heteroscedasticity.
All of the above.
14. The law of diminishing returns:
a.
b.
c.
d.
e.
Is reflected in the negatively sloped portion of the marginal
product curve.
Is the result of decreasing returns to scale of production.
Applies in both the short-run and long-run.
Occurs because of fatigue among workers as they work longer
hours.
All of the above are correct.
15. The combination of inputs is optimal:
a.
b.
At points of tangency between Isoquants and Isocosts.
If the marginal revenue product is equal to the marginal
resource cost in the case of every input.
If the marginal rate of technical substitution between every pair
of inputs is equal to the ratio of the prices of those inputs.
Along the output expansion path.
All of the above are correct.
-3-
Il.
TRUE or FALSE (20 points total). Label your answers to the following
10 statements with either a T or an F and briefly justify your answer.
(Each answer is worth a maximum of 2 points: 1 point for accuracy of
answer and 1 point for the justification provided).
1. Business profit is equal to total revenue minus all implicit costs.
2. A firm should continue to increase an activity as long as the total
revenue from the activity exceeds the total cost of the activity.
3. Ifthe price elasticity of demand for a firm’s output is found to be
inelastic, then a decrease in price will reduce the firm’s total revenue.
4. The more substitutes for a commodity, the lower the price elasticity of
demand for the commodity.
5. Ifthe price of a commodity rises and the amount sold increases, this
indicates that the demand curve for the commodity is upward sloping.
6. The coefficient of determination of a regression is calculated as the
ratio of the explained variation in the dependent variable to the
unexplained variation in the independent variable.
7. The fundamental assumption of time-series analysis is that past
patterns in the observed data will not continue into the future.
8. Iftwo forecasting methods are applied to the same data set, the method
that yields the larger root-mean-square error (RMSE) is preferred.
9. Output elasticity is calculated as the ratio of the marginal product of
the variable input to the marginal product of the fixed input.
10. If the marginal rate of technical substitution is the same at all points on
an isoquant, then the two inputs in the production function are perfect
complements.
PROBLEMS - 50 points total for problems HI, IV, and V
Il.
IV.
15 points for correctly answering parts a,b, andc. A firm’s demand
function is given by: Q = 40 - 2P, while its total cost function is given by
TC= 100 + 2Q + 0.25 Q*2
a. For 5 points. Determine the firm’s profit function.
b. For 5 points. Determine the level of output that results in
maximum profits and the level that results in minimum
profits.
c. For 5 points. What is the level of profit at the optimum level
of output?
15 points for correctly answering parts a, b, and c. A firm has estimated
the following demand function for its product:
Q= 100-5P+ 59+ 15A
where Q is quantity demanded per month (in thousands), I is an index of
consumer income, and A is advertising expenditure per month (in
thousands). Assume that P = 200, I = 150, and A = 30.
-Y-
Vv.
bay
a. For 7 points. Calculate the quantity demanded and the point elasticity
of demand. At what price is demand unitary elastic?
b. For 5 points. Calculate the point income elasticity of demand
and indicate whether the good is normal or inferior
c. For 3 points. Calculate the advertising elasticity of demand.
20 points for correctly answering parts a,b, c,d, ande. A
pharmaceuticals company estimated the following regression for one of its
medications. The estimation process utilized quarterly data for the period
starting in the first quarter of 1995 and ending in the first quarter of 2003.
The results were as follows:
Ss
= -1.04 + 0.24 A - 0.27Z
Where S = quarterly sales (in thousand cases); A = Quarterly advertising
expenditures; and Z = Quarterly advertising by competitors who produce
similar medications. Additional results of the regression included:
Se = 1.63 ; Sa = 0.032; S:= 0.070; R-square = 0.64; F-ratio = 31.402
a.
b.
For 4 points. Are the signs of the coefficients in conformity with what
one would expect on the basis of general theory. EXPLAIN why.
For 4 points. Which of the independent variables (if any) appear to be
statistically significant at the 5% level?
. For 4 points. What proportion of the total variation in sales is
explained by the regression? What proportion is not explained?
. For4 points. What would an F-test of these results indicate?
. For 4 points, Assuming annual expenditures on advertising in 2003
to be 4,000 by the company and 2,000 by its competitors, what would
be the projected level of sales in the last quarter of 2003?
_ b-
Appendix C Statistical Tables 677
1
}
H
l
0
~ Brobabiliti
Note: The probabilities given in the table are for two-tailed tests. Thus, a probability of 0.05 allows for 0.025 in
each tail. For example, for the probability of 0.08 and 21 df, ¢ = 2.080. This means that 2.5 percent of the area
under the t distribution lies to the right of t = 2.080, and 2.5 percent to the left of : = ~2.080.
Source: From table II of Fisher and Yates, Statistical Tables for Biological, Agriculrural and Medical Research, 6th
ed., 1974, published by Longman Group Ltd., London (previously by Oliver & Boyd, Edinburgh), by permis-
sion of the authors and publishers.
: 1
161
fs 2 14.5
3° 10.1
40° 72
8 5. 6.61
6, 5.99
7 8.59
: 8 5.32
} 9532
10: 4.96
4.84
475
ABT
4.60
4.54
449,
4.45
200
ALAR
216 225-230-234
19.2. 19.2 19.3 19,3
9:28 9.12 9.01 8.94
6.59". 6,39. 6.26 6.16
B41 5.19 5.05. 4,95
416 453 4.39 4.28
435.412 3,97 3.87
4.07 3.84 3.69” 3.58
3.86. 3.63". 3.48 3.37
3.71 3.48 3.33 3.22
613-59." 3.36-" 3.20.” 3,09
3.49 23.26 3.11 .3.00
PBL 3 AB 293,03. .2.92
V3.B4 BAL, 2.96.°0'2.85,
3.29 2.3.08. 2.90. 2,79
R24 LOL 2.85 276
Degrees of Freedom for Numerator
7 8 9 10 12° 15 20
237. 239 241262 Hh 246248
194° 19.4 19.4 19.4 19.6 19.6 19.5
8.89 8.85 8.81 8.79 B74 8.70. 8.66
6.09. 6 6.00 §.96 5.91. 5,86 5.80
4.88 4IT T4468 4.62 > 4.56
4.21 410. 4.06 - 4,00 3.94. 3.87
3.79 3.68 3.64 3.57 3.51 3.46. 3.4
3.50 3.35. 3.28 3.22
3.29 3.14. 3,07" 3.01
ERG 2.98 2.91 2.85
3.01 279° 2.72 2.65
2.91 2.69. 2.62. 2.54. 2:
2.83
2.76
an
33, 1943, p
P-Distribution <t pper 3 Pereeat Points
10 12 1 60 10
215.7 224.6 230.2 234.0 2368 238.9 MOS 241.9 243.9 245.9 WBKO 291 250 251.1 2522 253.3 254.3
19.16 19.25 19.30 19.33 1935) 19.37 1938 1940 1941 1943 1945 1945 1946 19-47 1948 1949 19.50
928 912 901 894 889 BAS BRI B79 RTF R70 866 B64 862 859 B57 855 B53
6.59 639 6.26 616 609 604 600 595 591 585 580 577 575 572 569 5.66 5.63
SA 5.19 5.05 4.95 488 482 4.77 474 468 4.62 456 4.53 450 446 443 440 4.36
4760 453 439 428 4.21 4.15 410 406 400 3.94 387 384 381 3.77 374 3.70 3.67
435 412 397 387 379 373 368 364 357 351 4 341 338 334 3.300 3.27 3.23
407 38+ 3.69 3.58 3.50 3443.39 3.35 3.28 3.22 3.12 3.08 3.04 301 297 2.93
386 3.63 348 337 3.29 318 314 307 3.0 290 286 283 279 275° DL
da NIGNaday
274 270 266 2.62 254
261 257 2.49 2.40
251 AT 2.38 2.30
242 2.38 2.30 2.21
235 31 2.22 213
229° 2.25 2.07
224 2.01
219 1.96
2152 2.02 1.92
211 3 1 1.88
1.84
181
1.78
1.76
173
L71
1.69
2.20 1 i 1.67
2.19 1.65
2.18 1.64
3.02
2.90
2.80
2n
2.65
9
291
2.79
2.69
2.60
253
3
3
‘S
2B
348 3.33 34
3.36 © 3.20 3.01
3.26 3.11 291
3.18 3.03 2.83
BAL 2.96 5 2.76
2
saqey
ees
33
Ba
Newny
Ss
6
248
242
2.38
234
2.31
=a
3.06 2.90 271
3.01 2.85 2.66
2.96 2.81
2.93
2.90
287
284
ao
&
3
Ryo B
o
3
Neen
as
Mwy
,
VRBO OF
18
19
Eva
e
8
25
23
20
Now
8
Qu
hemes
Sn
ao
& SB
ae
S$
NNR
VN
Bann
ra
z
ewe
N
&
ee
aan
&
N
S
es
ge
&
Neen
New
2210 2.16 1.62
212 2 2 151
2.04 1.99 J 1.39
196 1.91 : 6 1.25
1.88 1.83 1 1.00