
EECE 312L Notes Experiment 4 Notes, Fall 2013
American University of Beirut · Circuits and Electronics Lab · 9 pages
More EECE 312L files
- Notes Experiment 2 Notes · Fall 2013NotesView
- Notes Experiment 3 Notes · Fall 2013NotesView
- Notes Experiment 11 Notes · Fall 2013NotesView
- Notes Experiment 7 Noes · Fall 2013NotesView
- Notes Experiment 5 Notes · Fall 2013NotesView
- Notes Experiment 6 Notes · Fall 2013NotesView
- Notes Experiment 10 Notes · Fall 2013NotesView
- Notes Experiment 1 Notes · Fall 2013NotesView
Show the text of this notes
Experiment 4
RC and RLC Circuits
What are the different ways for measuring the phase shift?
Method 1:
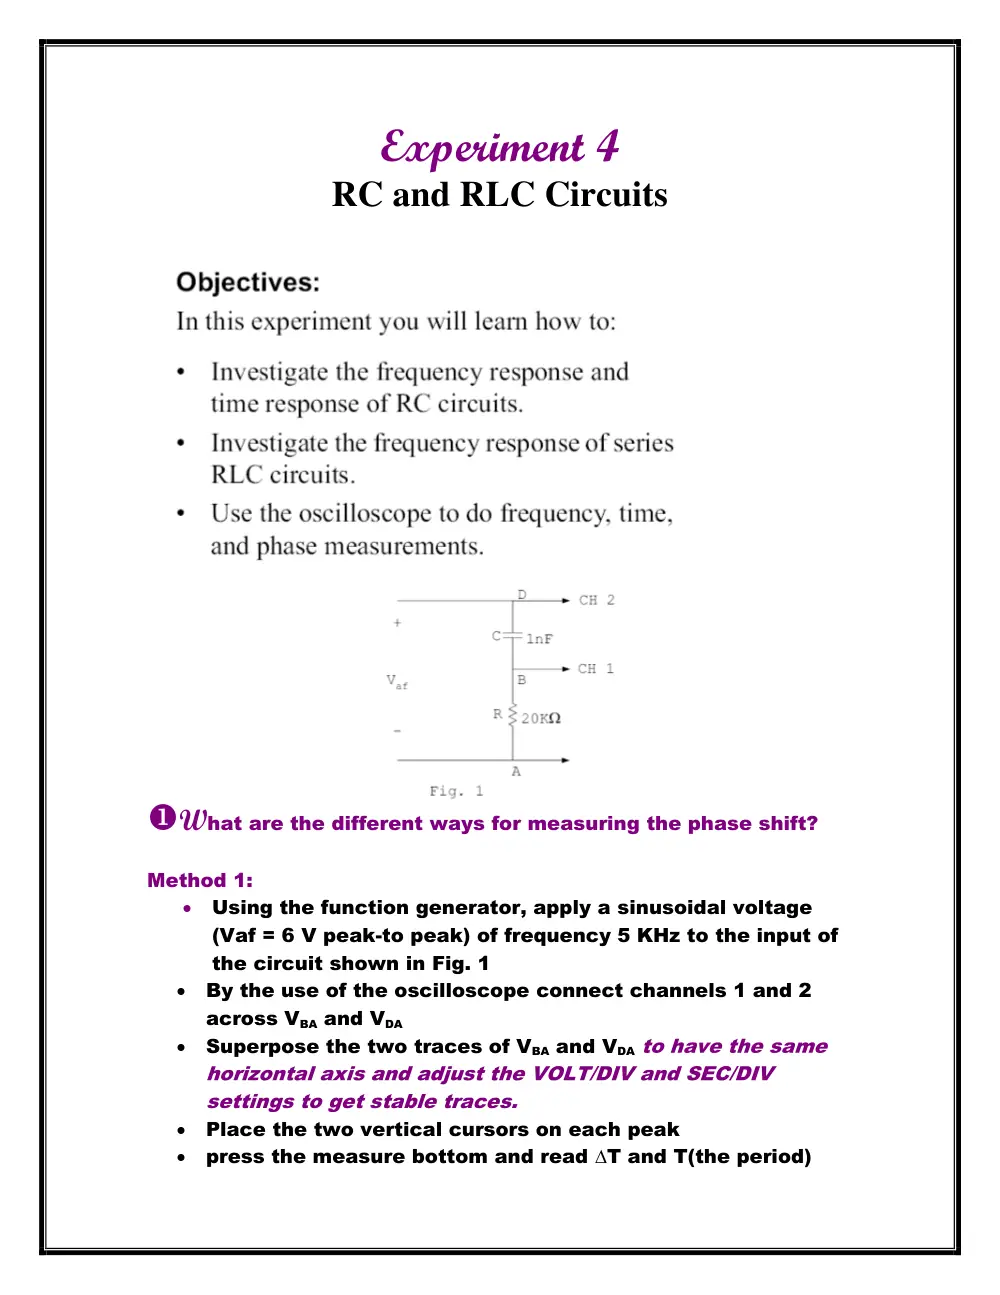
Using the function generator, apply a sinusoidal voltage
(Vaf = 6 V peak-to peak) of frequency 5 KHz to the input of
the circuit shown in Fig. 1
By the use of the oscilloscope connect channels 1 and 2
across VBA and VDA
Superpose the two traces of VBA and VDA to have the same
horizontal axis and adjust the VOLT/DIV and SEC/DIV
settings to get stable traces.
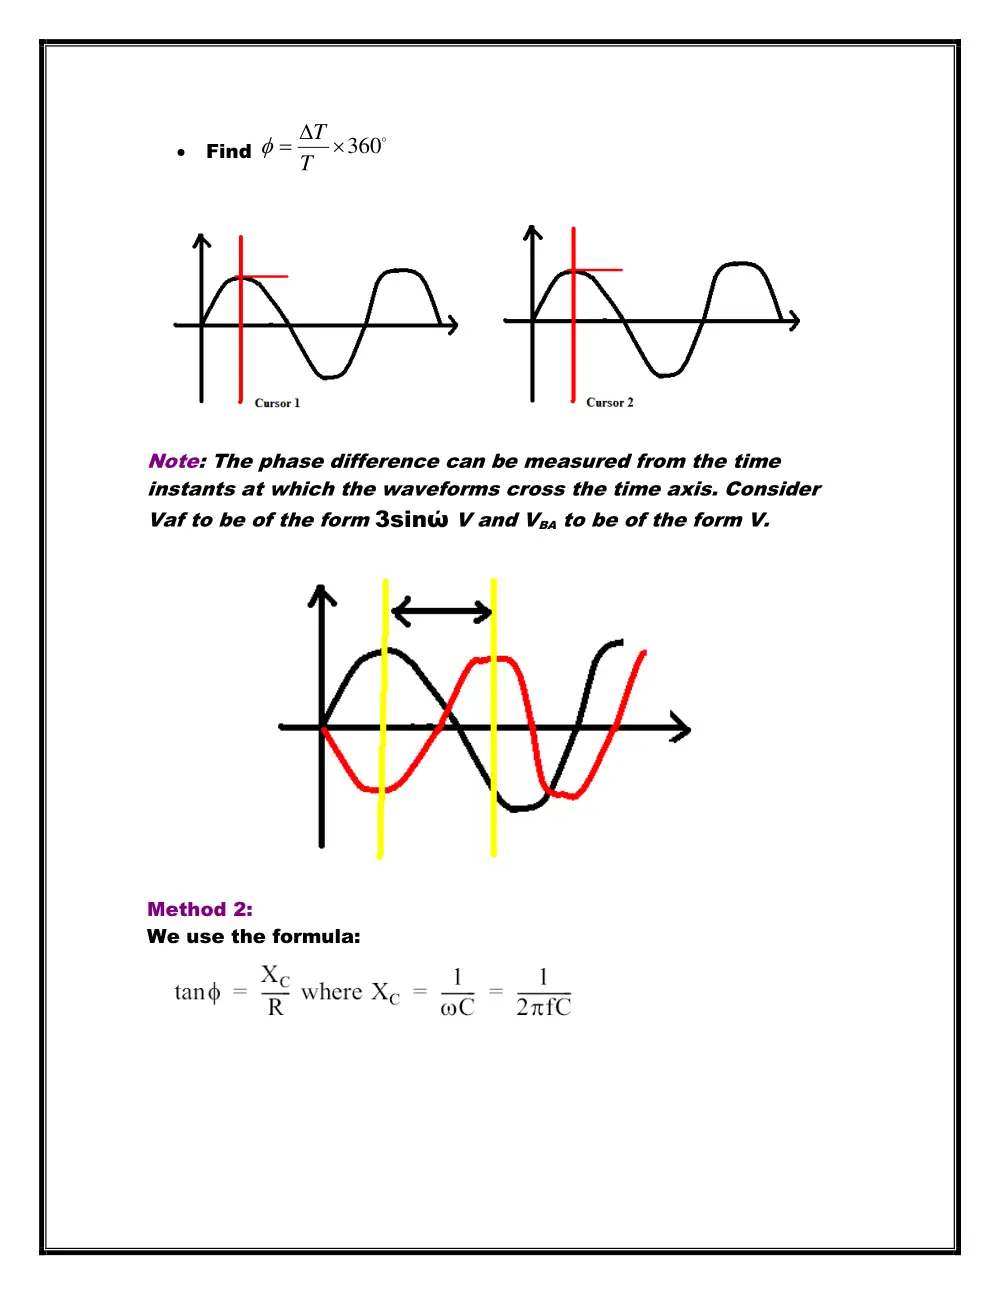
Place the two vertical cursors on each peak
press the measure bottom and read ∆T and T(the period)
Find
360
T
T
Note: The phase difference can be measured from the time
instants at which the waveforms cross the time axis. Consider
Vaf to be of the form 3sinώ V and VBA to be of the form V.
Method 2:
We use the formula:
Method 3- Lissajous method:
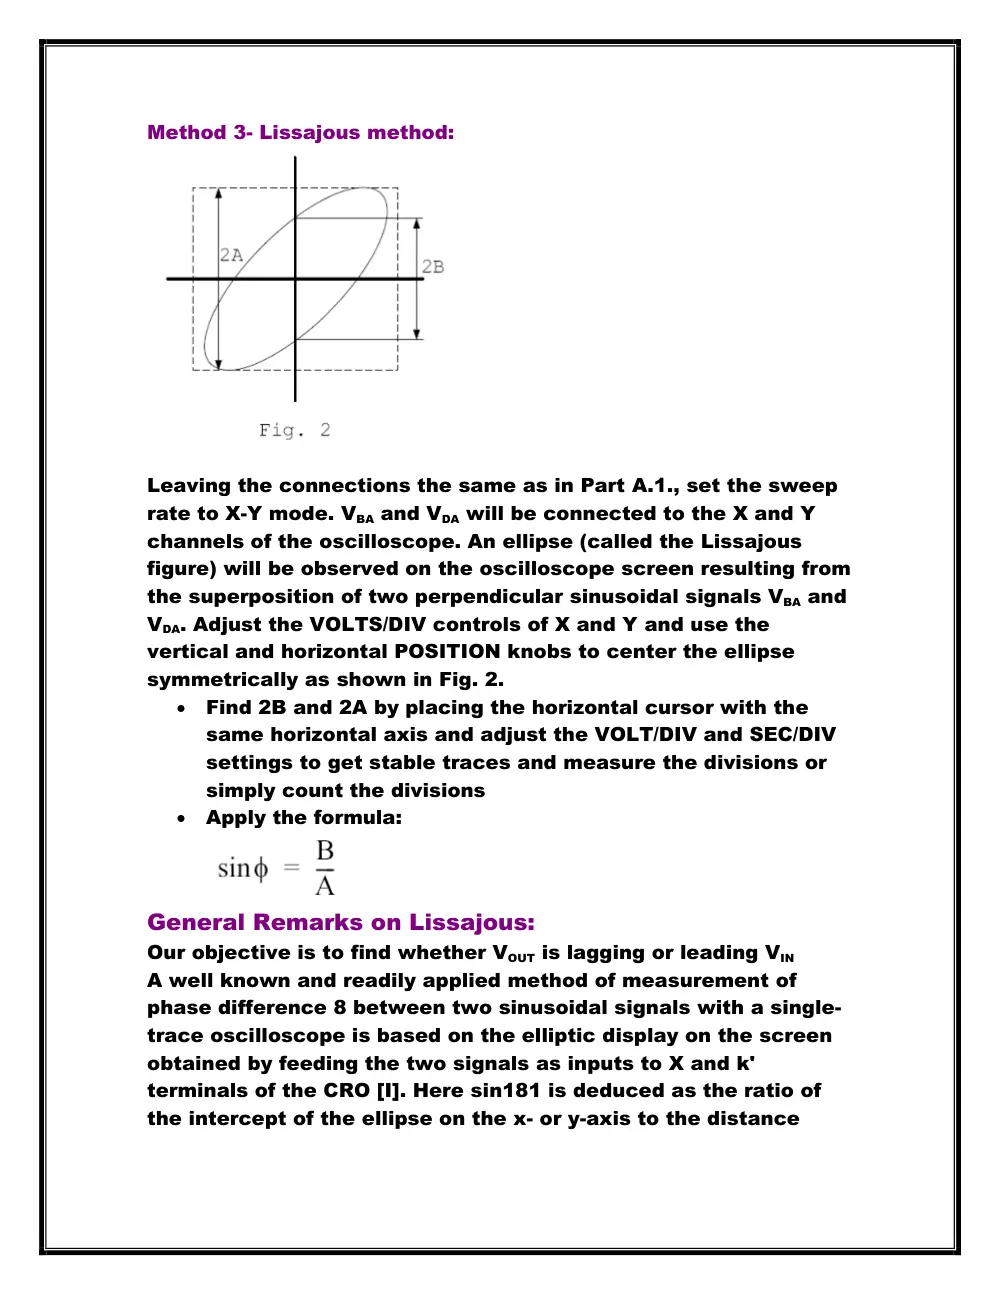
Leaving the connections the same as in Part A.1., set the sweep
rate to X-Y mode. VBA and VDA will be connected to the X and Y
channels of the oscilloscope. An ellipse (called the Lissajous
figure) will be observed on the oscilloscope screen resulting from
the superposition of two perpendicular sinusoidal signals VBA and
VDA. Adjust the VOLTS/DIV controls of X and Y and use the
vertical and horizontal POSITION knobs to center the ellipse
symmetrically as shown in Fig. 2.
Find 2B and 2A by placing the horizontal cursor with the
same horizontal axis and adjust the VOLT/DIV and SEC/DIV
settings to get stable traces and measure the divisions or
simply count the divisions
Apply the formula:
General Remarks on Lissajous:
Our objective is to find whether VOUT is lagging or leading VIN
A well known and readily applied method of measurement of
phase difference 8 between two sinusoidal signals with a single-
trace oscilloscope is based on the elliptic display on the screen
obtained by feeding the two signals as inputs to X and k'
terminals of the CRO [I]. Here sin181 is deduced as the ratio of
the intercept of the ellipse on the x- or y-axis to the distance
between the projections of the extreme points of the ellipse on
the same axis.
One method for measuring phase shift is to use XY mode. This
involves inputting one signal into the vertical system as usual
and then another signal into the horizontal system. (This method
only works if both signals are sine waves.) This set up is called
an XY measurement because both the X and Y axis are tracing
voltages. The waveform resulting from this arrangement is called
a Lissajous pattern (named for French physicist Jules Antoine
Lissajous and pronounced LEE-sa-zhoo). From the shape of the
Lissajous pattern, you can tell the phase difference between the
two signals. You can also tell their frequency ratio. Figure 6
shows Lissajous patterns for various frequency ratios and phase
shifts.
How do we know if the voltage leads or lags from the
oscilloscope?
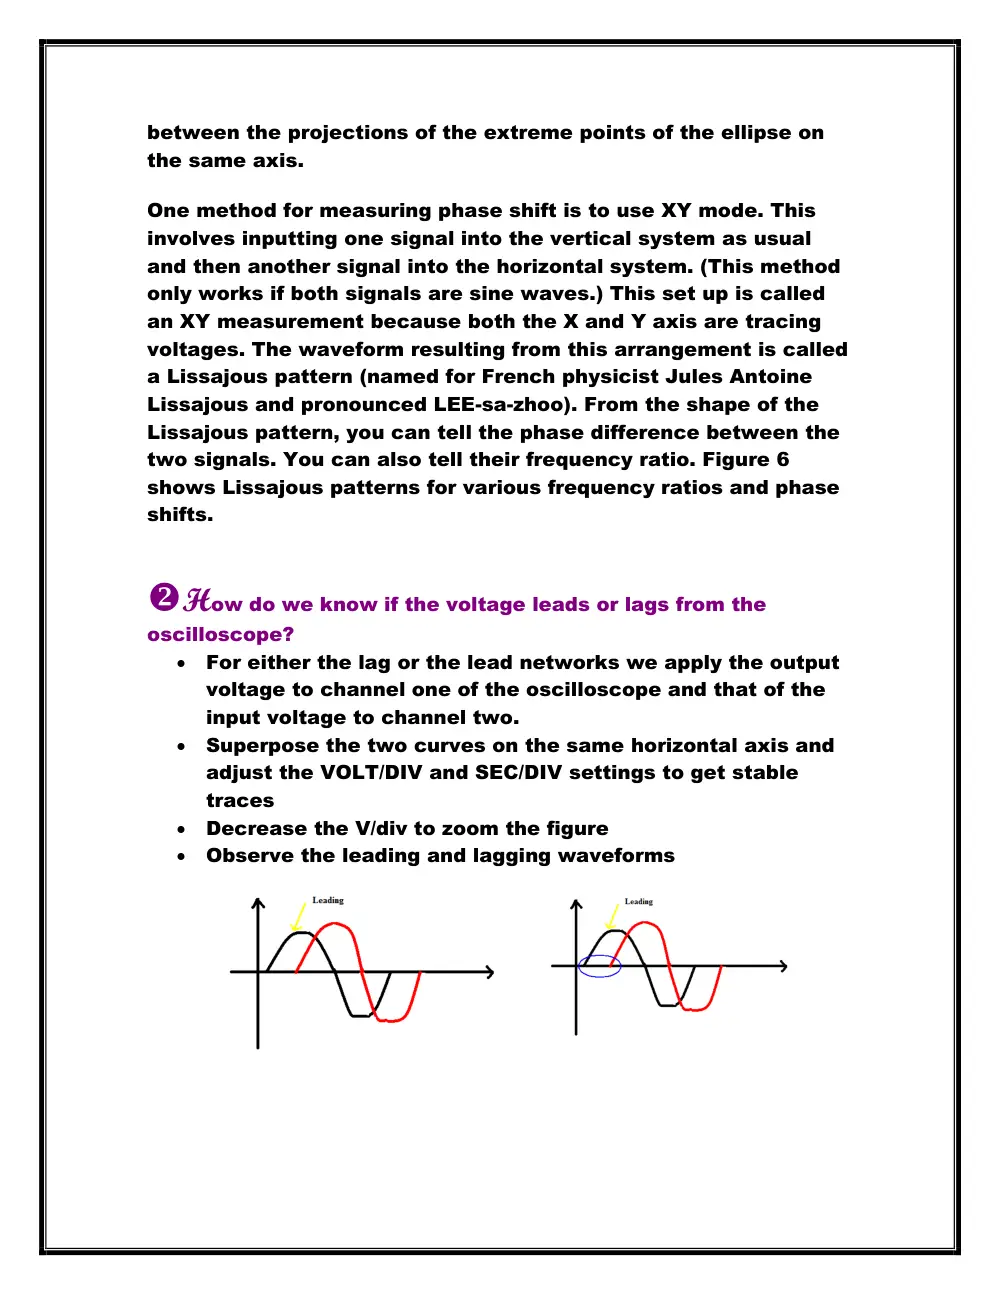
For either the lag or the lead networks we apply the output
voltage to channel one of the oscilloscope and that of the
input voltage to channel two.
Superpose the two curves on the same horizontal axis and
adjust the VOLT/DIV and SEC/DIV settings to get stable
traces
Decrease the V/div to zoom the figure
Observe the leading and lagging waveforms
Remark: We can never measure the current using the
oscilloscope. If we need the current waveform we measure the
voltage and divide it by the resistance R.
Note: The maximum frequency is the frequency at
resonance.
Lag networks: (Low-Pass Filter)
Lead networks: (High-Pass Filter)
RLC (Band pass filter):
Explain the shape of the output waveforms of the lag
and lead networks to square wave inputs of various
frequencies, with particular reference to the
fundamental property of a capacitor not changing its
voltage instantaneously.
The lag and the lead networks differ in the output voltage.
In the lag network, as the frequency increases, the shape of Vout
tends to deviate more from the square shape. In the lead
network, as the frequency decreases, the shape of Vout tends to
deviate more from the square shape. Since the fundamental
property of a capacitor states that the voltage can’t change
instantaneously, it changes exponentially Vc = V0 * e (-t/RC) with a
time constant parameter ô = RC.
The relationship between the RC time constant and the
frequency of the square wave so that:
If 1/F >>RC (RC is small):
The lag network does not appreciably distort the square
wave.
The lead network is a differentiator.
If 1/F <<RC(RC is large):
The lead network does not appreciably distort the square
wave.
The lag network is an integrator.
What should be the relationship between the RC time constant
and the frequency of the sinusoidal input so that:
The lag network does not introduce appreciable
attenuation: RC and F should be both small
The lead network does not introduce appreciable
attenuation: RC and F should be both large
These relationships are the same for the sinusoidal and square
wave input functions.
Fourier theorem states that any periodic function can be
expressed as the sum of a series of sine and cosine terms, each
of which has specific amplitude and phase coefficients.
Note: The cutoff frequency is defined as the frequency at which
the output amplitude is 1/√2 times its maximum value.
A low-pass filter is a filter that passes low frequency signals but
attenuates signals with frequencies higher than the cutoff
frequency.
Cutoff frequency= 1/ (2╥ x R x C)
A high-pass filter is a filter that passes high frequencies well, but
attenuates frequencies lower than the cutoff frequency. Cutoff
frequency= 1/ (2╥ x R x C)
The cut-off frequency for the series RC circuit has the value 1/
(2╥ x R x C) whether the circuit is configured as a low-pass filter
or a high pass filter.
Considering one of the RC elements to be source impedance,
and the other to be load impedance, explain the integrating and
differentiating action of these networks on the basis of the
relationship between source and load impedances in the s
domain.
The integrating and differentiating action could be explained
using the S-domain.
In Integrator we consider only high frequencies, so that the
capacitor has insufficient time to charge up, so the input voltage
approximately equals the voltage across the resistor.
The formula of the integrating low pass lag filter where R is the
source impedance and C is the load impedance is
H(s)=wc/(wc+s)=(1/RC)/[s+(1/RC)]
In Differentiator, we consider only low frequencies, so that the
capacitor has time to charge up until its voltage almost equals
that of the source.
The formula of the differentiating high pass lead filter where C is
the source impedance and R is the load impedance is:
H(s)=s/(wc+s)=s/[s+(1/RC)]
The sum of the average voltages across the capacitor and
that across the resistor will be equal to the average value of the
input voltage:
VDC= VCDC + VRDC
How do we calculate the cutoff frequency F in lead or lag
networks?
Measure the output voltage and get the peak value (or
maximum value)
Find Vmax/ √2
Vary the frequency up and down until we get the same
output voltage
We will get two values of the cutoff frequency (up and down
movements).
Note: Bandwidth is defined as f2 - f1, where f2 and f1 (f2 > f1) are
the frequencies where the magnitude of the transfer function is
times its maximum value.
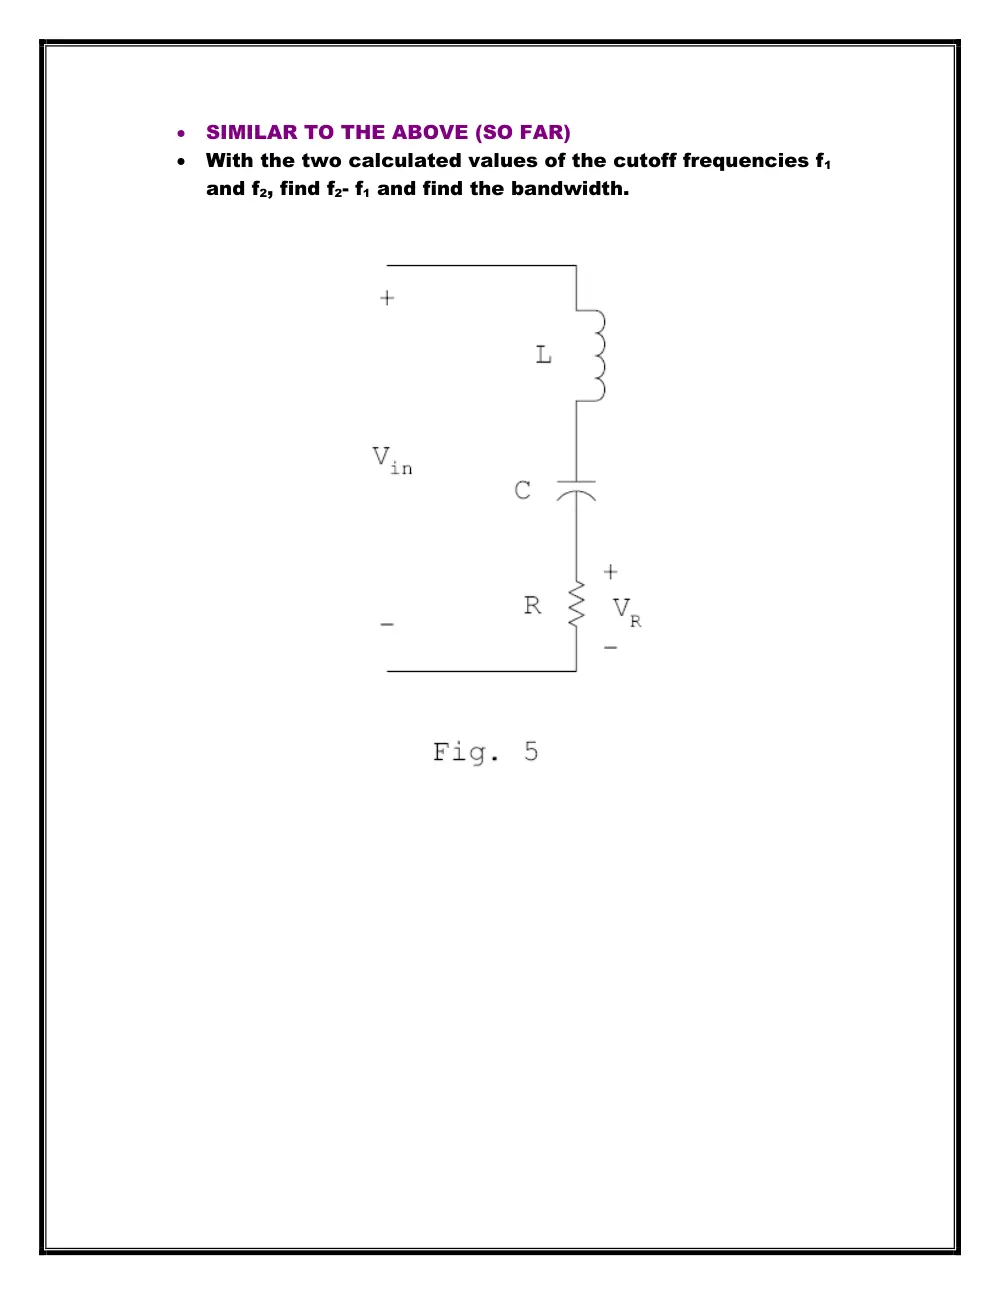
How do we calculate the bandwidth in the RLC circuit?
Measure the output voltage and get the peak value (or
maximum value)
Find Vmax/ √2
Vary the frequency up and down until we get the same
output voltage
We will get two values of the cutoff frequency (up and down
movements).
SIMILAR TO THE ABOVE (SO FAR)
With the two calculated values of the cutoff frequencies f1
and f2, find f2- f1 and find the bandwidth.