
EECE 460 Homework, Spring 2007
American University of Beirut · Control Systems · 3 pages

More EECE 460 files
Show the text of this homework
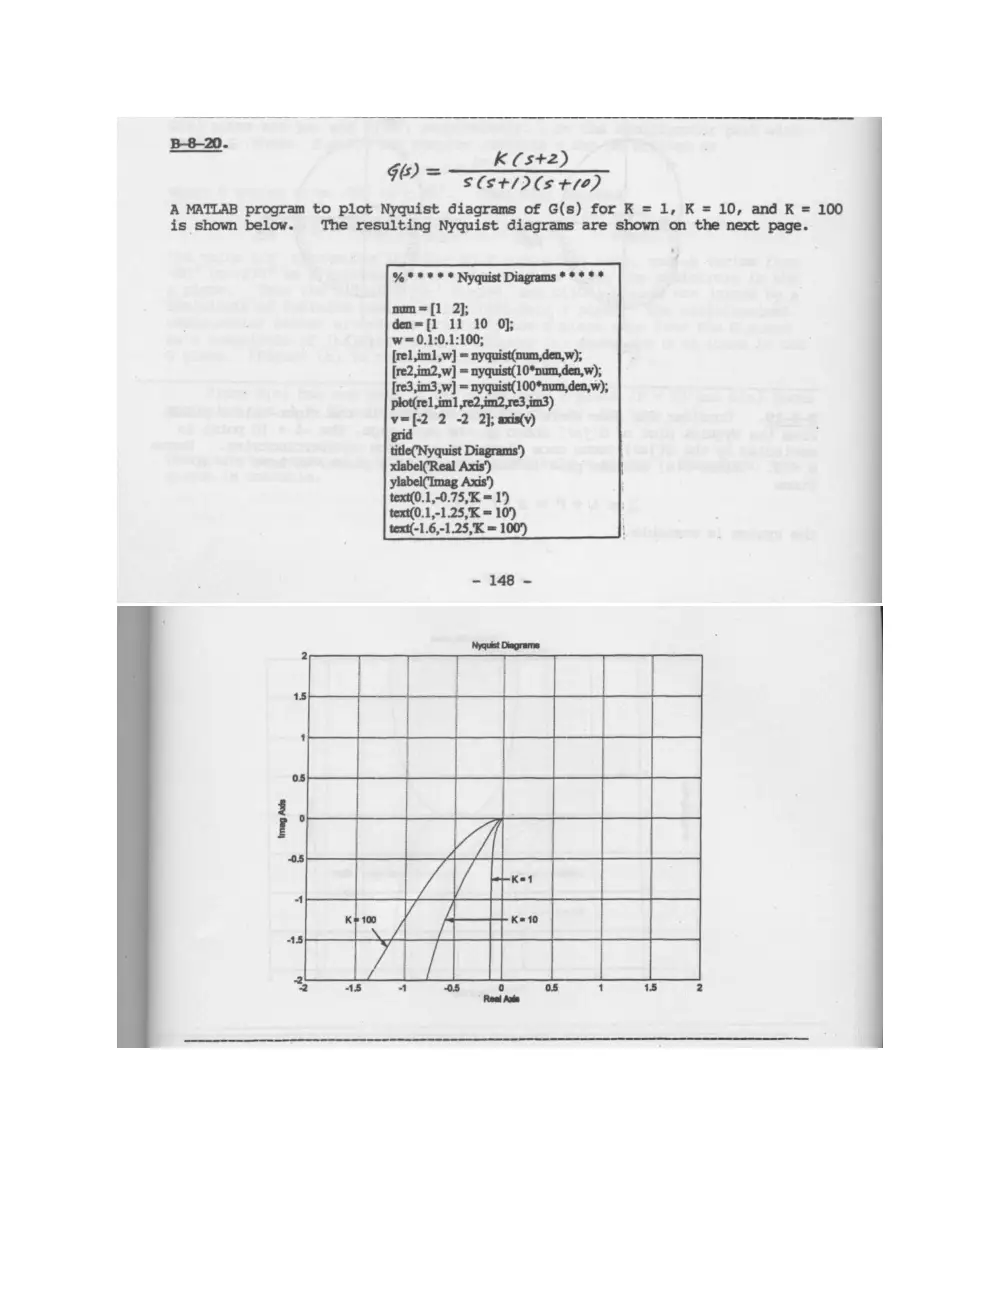
a K (st2)
fies (st/D(s +10)
A MATLAB program to plot Nyquist diagrams of G(s) for K = 1, K = 10, and K = 100
is shown below. The resulting Nyquist diagrams are shown on the next page.
%*** * * Nyquist Diagrams *** * *
num=[1 2};
den=[1 11 10 0];
w=0.1:0.1:100;
[rel im1,w] = nyquist(num,den,w);
[re2,im2,w] = nyquist(10*num,den,w),
[re3,im3,w] = nyquist(100*num,den,w);
plot(re] im1 ,re2,im?,re3,im3)
Mr 2 -2 2}; axis(v)
text(0.1,-0.75,K = 1‘)
text(0.1,-1.25;K = 10)
text(-1.6,-1.25,K = 100)
- 148 -
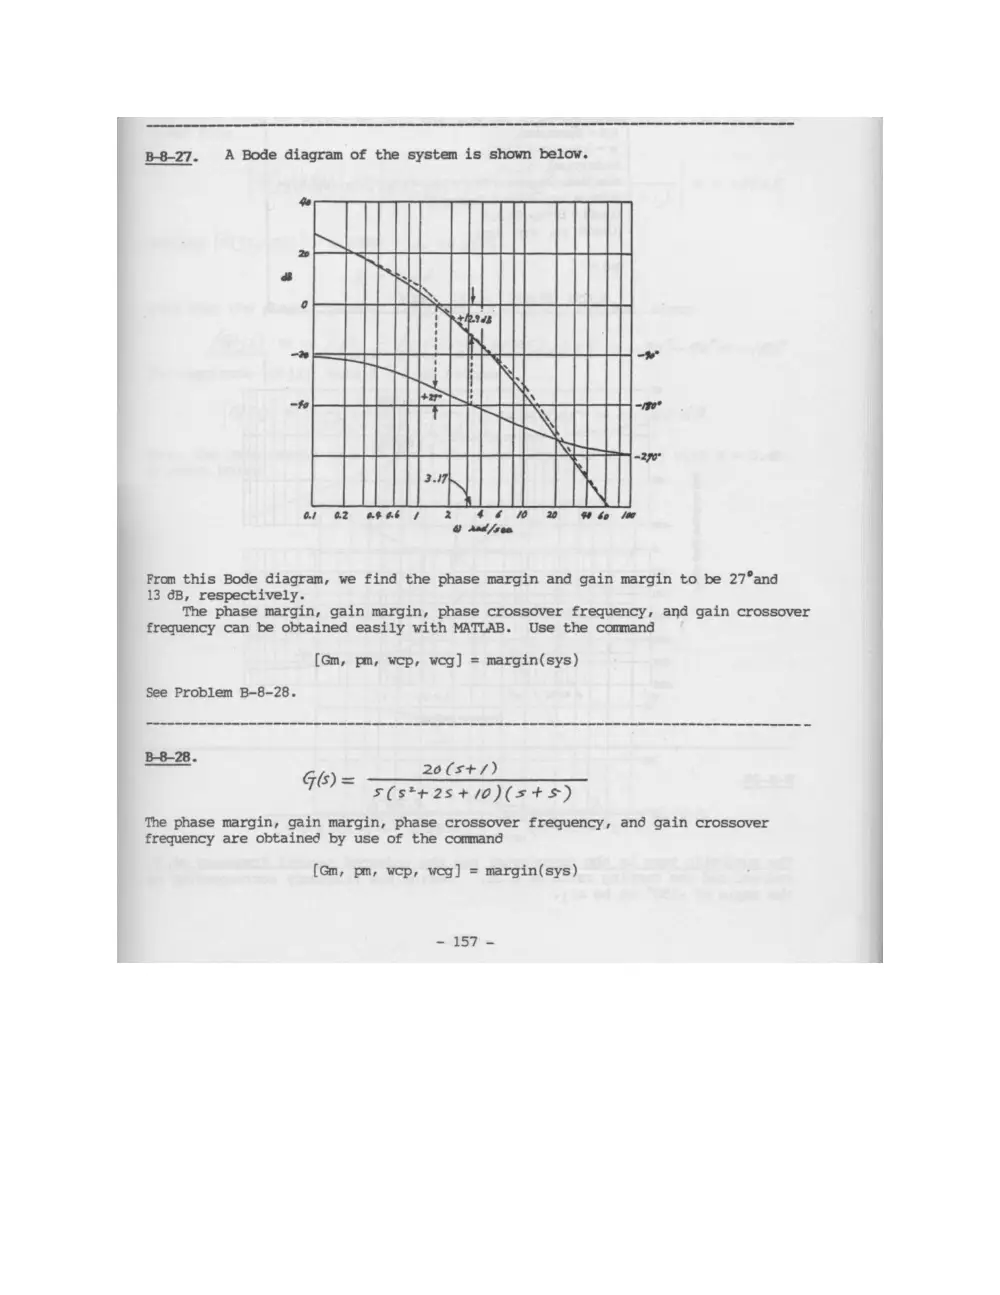
B-8-27. A Bode diagram of the system is shown below.
TL
ACHAT
HS a
SUT
MTR
PAIL NIL
Ot O2 OFOb 7 2 46 0 20 bo la
@ Asd/ren
From this Bode diagram, we find the phase margin and gain margin to be 27°and
13 6B, respectively.
The phase margin, gain margin, phase crossover frequency, and gain crossover
frequency can be obtained easily with MATLAB. Use the command
[Gm, pm, wep, wog] = margin(sys)
See Problem B-8-28.
_ GL 20(st+/)
76) S(s*t2s+/0)(st+s)
The phase margin, gain margin, phase crossover frequency, and gain crossover
frequency are obtained by use of the command
(Gm, pm, wep, weg] = margin(sys)
- 157 -
A MATLAB program to solve this problem is given below. The Bode diagram shown
below verifies the phase margin, gain margin, phase crossover frequency, and gain
crossover frequency obtained with MATLAB.
% thee Bode Diagram cence
— 0 0 20 20);
=conv([1 2 10 O}f1 5);
o" keeentniec
w= -|
bode(sys,w)
title(Bode Diagram of G(s) = 20(s+1)/[s(s*2+2s+10\(s+:
[Gm,pm, wep, weg] = margin(sys); a
GmdB = 20*log10(Gm);
[GmdB pm wep weg]
9.9293 103.6573 4.0131 0.4426
) ar a TI
a
POCA PEt
10" 4926 40° 40131 10"
Frequency (red/sec)
8-35:
G(s) = 10 / (s*(0.17 s + 1))