
EECE 460 Homework, Spring 2008
American University of Beirut · Control Systems · 40 pages

Showing the first 10 of 40 pages. Download the PDF to see all of it.
More EECE 460 files
Show the text of this homework
Chapter 9 / Control Systems Design by Frequency Response 1
Example B-9-5
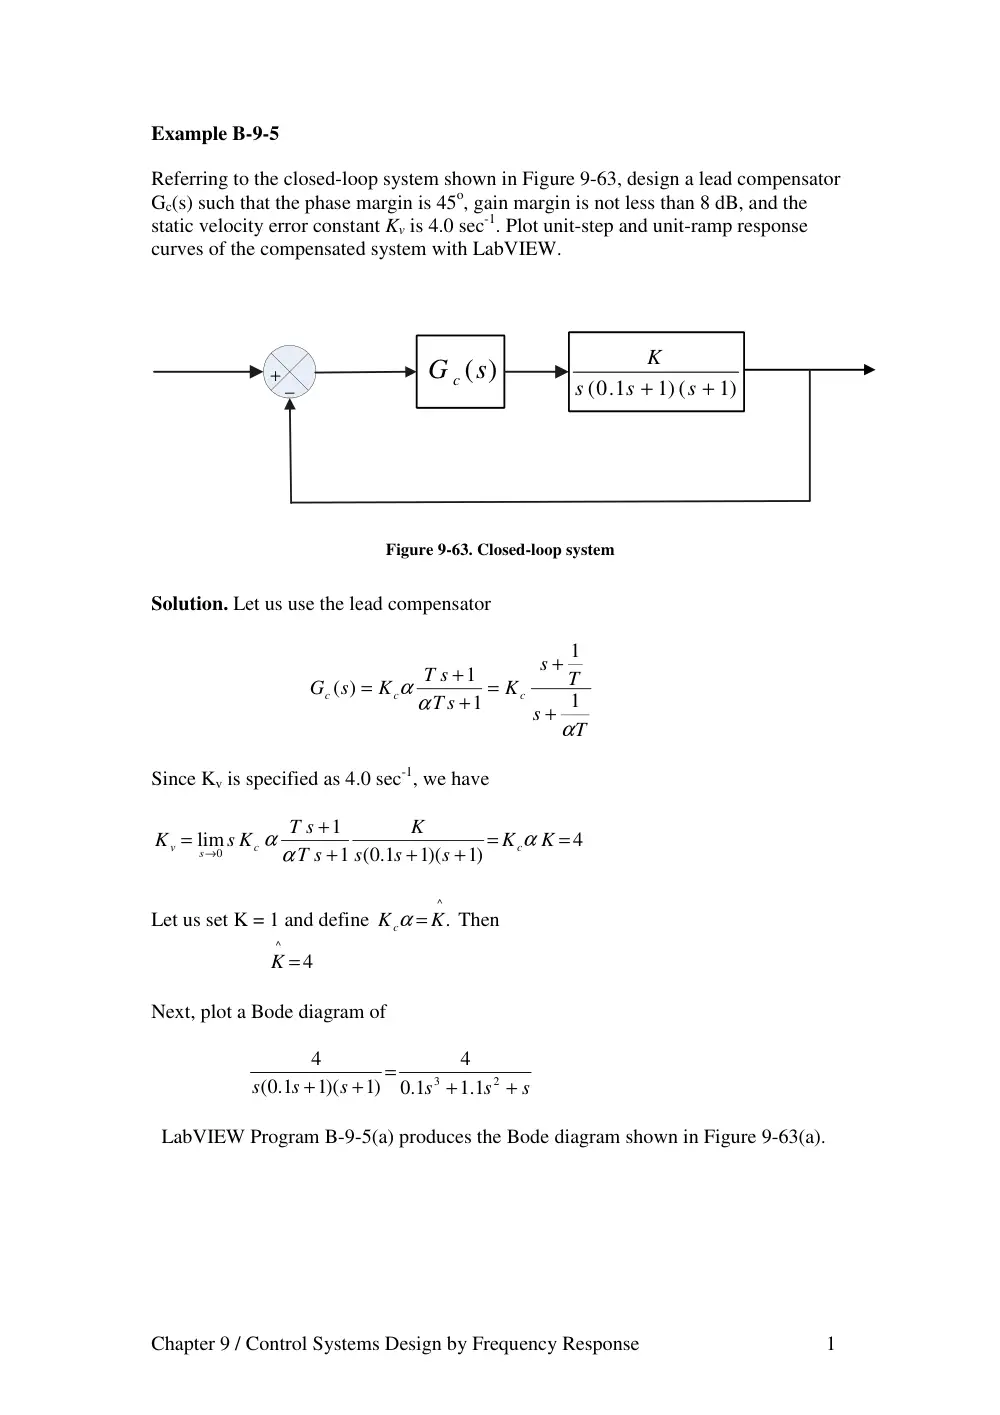
Referring to the closed-loop system shown in Figure 9-63, design a lead compensator
Gc(s) such that the phase margin is 45o, gain margin is not less than 8 dB, and the
static velocity error constant Kv is 4.0 sec-1. Plot unit-step and unit-ramp response
curves of the compensated system with LabVIEW.
+
−
1)
1) (
(0 1.
+
+
s
s
s
K
(s)
G c
Figure 9-63. Closed-loop system
Solution. Let us use the lead compensator
T
s
T
s
K
T s
T s
K
s
G
c
c
c
α
α α
1
1
1
1
( )
+
+
=
+
+
=
Since Kv is specified as 4.0 sec-1, we have
4
)1
1)(
1 ( 1.0
1
lim
0
=
=
+
+
+
+
=
→
K
K
s
s
s
K
T s
T s
s K
K
c
c
s
v
α
α α
Let us set K = 1 and define
^
K.
K c
α =
Then
4
^
K =
Next, plot a Bode diagram of
s
s
s
s
s
s
+
+
=
+
+
2
3
1.1
1.0
4
)1
1)(
( 1.0
4
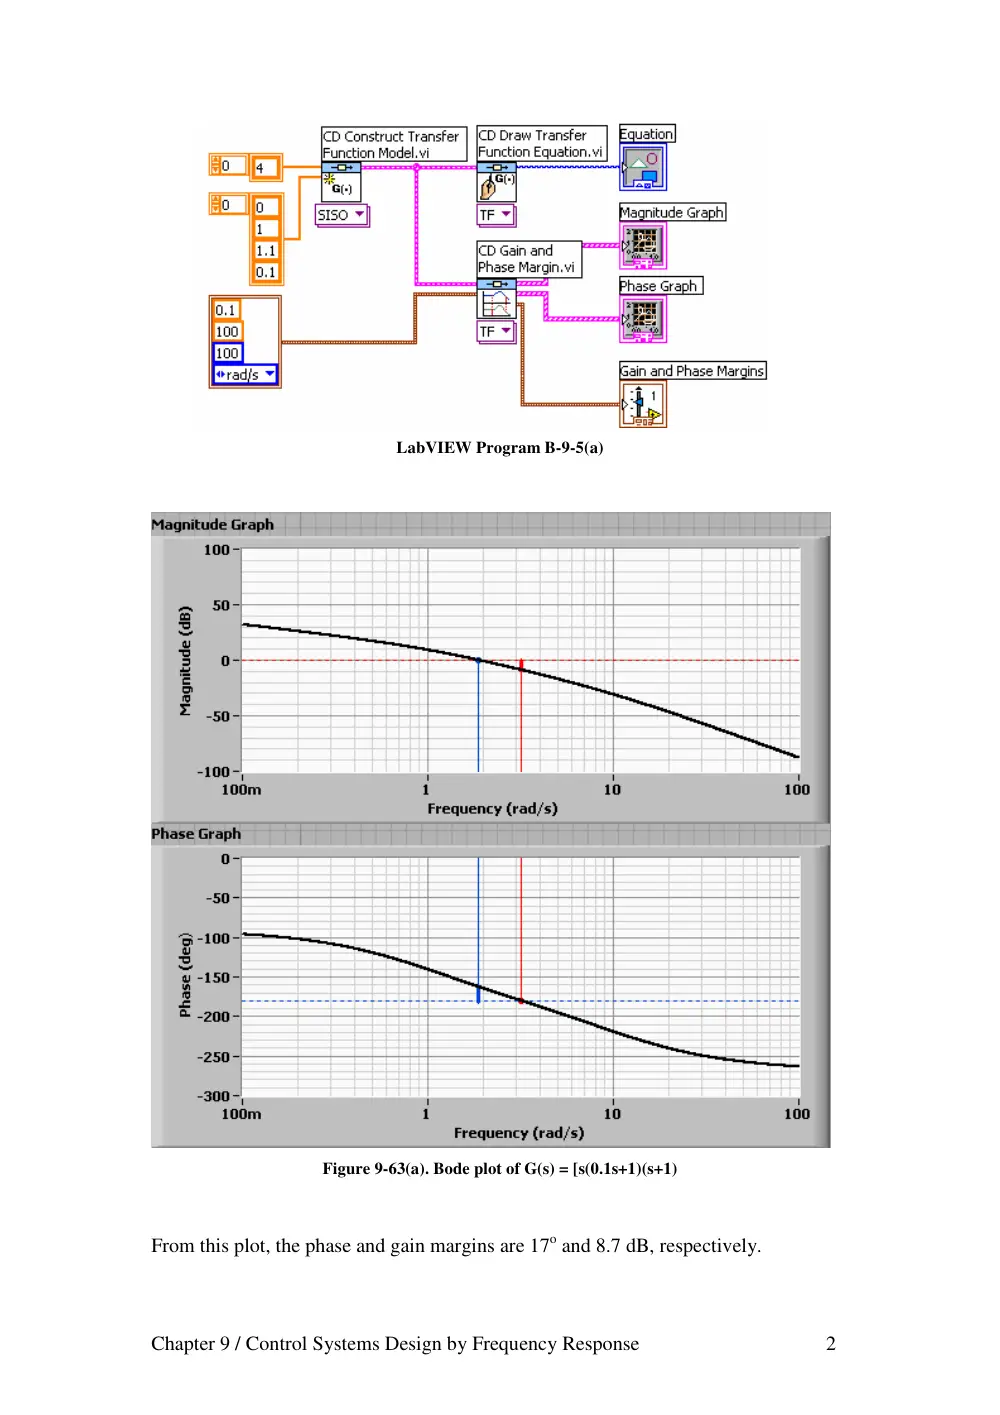
LabVIEW Program B-9-5(a) produces the Bode diagram shown in Figure 9-63(a).
Chapter 9 / Control Systems Design by Frequency Response 2
LabVIEW Program B-9-5(a)
Figure 9-63(a). Bode plot of G(s) = [s(0.1s+1)(s+1)
From this plot, the phase and gain margins are 17o and 8.7 dB, respectively.
Chapter 9 / Control Systems Design by Frequency Response 3
Since the specifications call for a phase margin of 45o, let we choose
ο
ο
ο
ο
φ
40
12
17
45
=
+
−
m =
(This means that 12o has been added to compensate for the shift in the gain crossover
frequency.) The maximum phase lead is 40o. Since
40 )
(
1
1
sin
ο
ϕ
α
α
ϕ
=
+
−
=
m
m
α is determined as 0.2174. Let us choose, instead of 0.2174, α to be 0.21,
or
α = 0.21
Next step is to determine the corner frequencies ω=1/T and ω=1/ (αT) of the lead
compensator. Note that the maximum phase-lead angle φm occurs at the geometric
mean of the two corner frequencies, or
)
1/(
αT
ω =
. The amount of the modification
in the magnitude curve at
)
1/(
αT
ω =
due to the inclusion of the term
(T s+1)/( αTs+1) is
α
ωα
ω
α
ω
1
1
1
)
1/(
=
+
+
=
T
T
j
j T
Note that
.
.6 7778
21
.0
1
1
dB
=
=
α
We need to find the frequency point where, when the lead compensator is added, the
total magnitude becomes 0 dB. The magnitude of G(jω) is -6.7778 dB corresponds to
ω = 2.81 rad/sec. We select this frequency to be the new gain crossover frequency ωc.
Then we obtain
.1 2877
.2 81
.0 21
1
=
=
=
x
T
α ωc
.6 1319
21
.0
.2 81
1
=
=
=
α
ω
α
c
T
Hence
.6 1319
.1 2877
( )
+
+
=
s
K s
s
G
c
c
and
.0 21
4
^
= α =
K
K c
Chapter 9 / Control Systems Design by Frequency Response 4
Thus
1
16308
.0
1
.0 7766
4
.6 1319
2877
.1
.0 21
4
( )
+
+
=
+
+
=
s
s
s
s
Gc s
The open-loop transfer function becomes as
s
s
s
s
s
s
s
s
s
s
s G s
Gc
+
+
+
+
=
+
+
+
+
=
2
3
4
.1 2631
.0 2794
.0 01631
4
1064
.3
)1
1)(
( 1.0
1
1
.0 16308
1
.0 7766
4
( )
)
(
the closed-loop transfer function is
4
.4 1064
.1 2631
.0 2794
.0 01631
4
.3 1064
( )
)
(
2
3
4
+
+
+
+
+
=
s
s
s
s
s
R s
C s
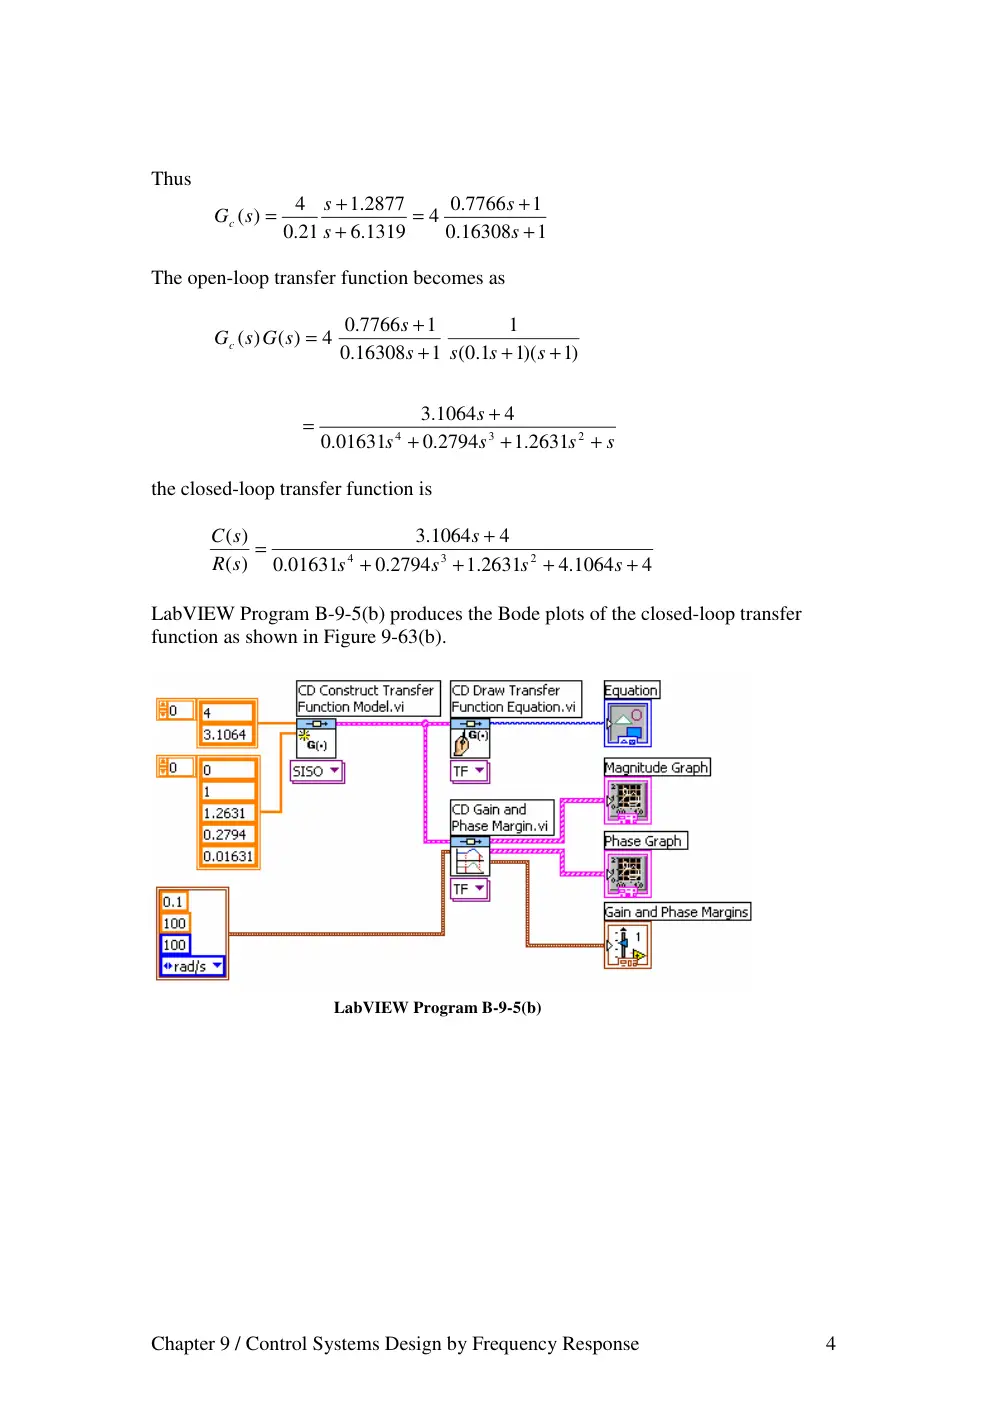
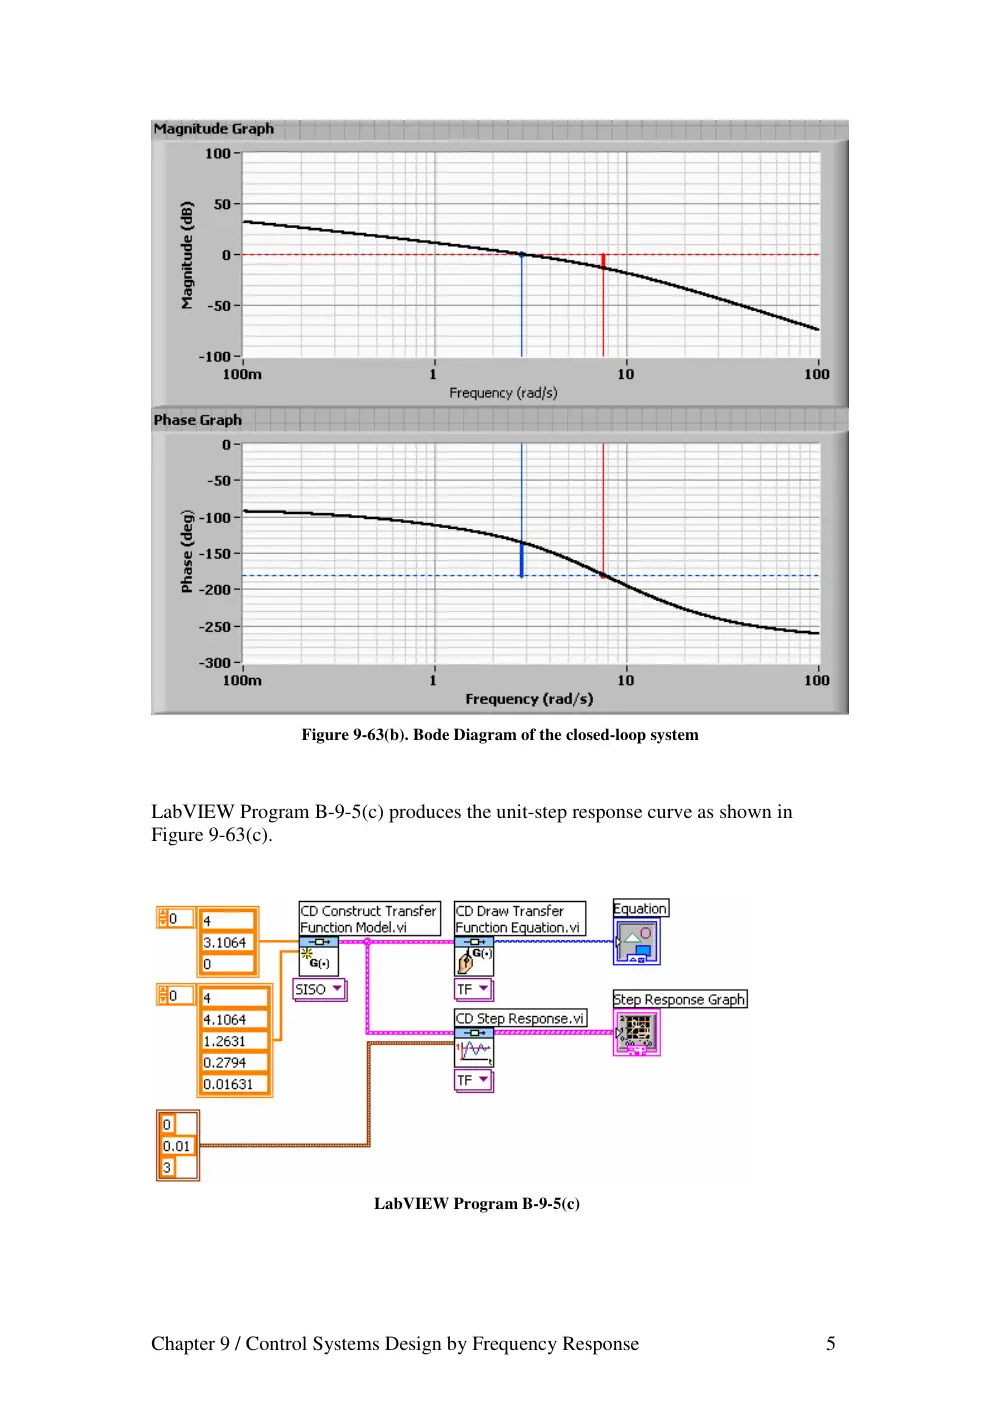
LabVIEW Program B-9-5(b) produces the Bode plots of the closed-loop transfer
function as shown in Figure 9-63(b).
LabVIEW Program B-9-5(b)
Chapter 9 / Control Systems Design by Frequency Response 5
Figure 9-63(b). Bode Diagram of the closed-loop system
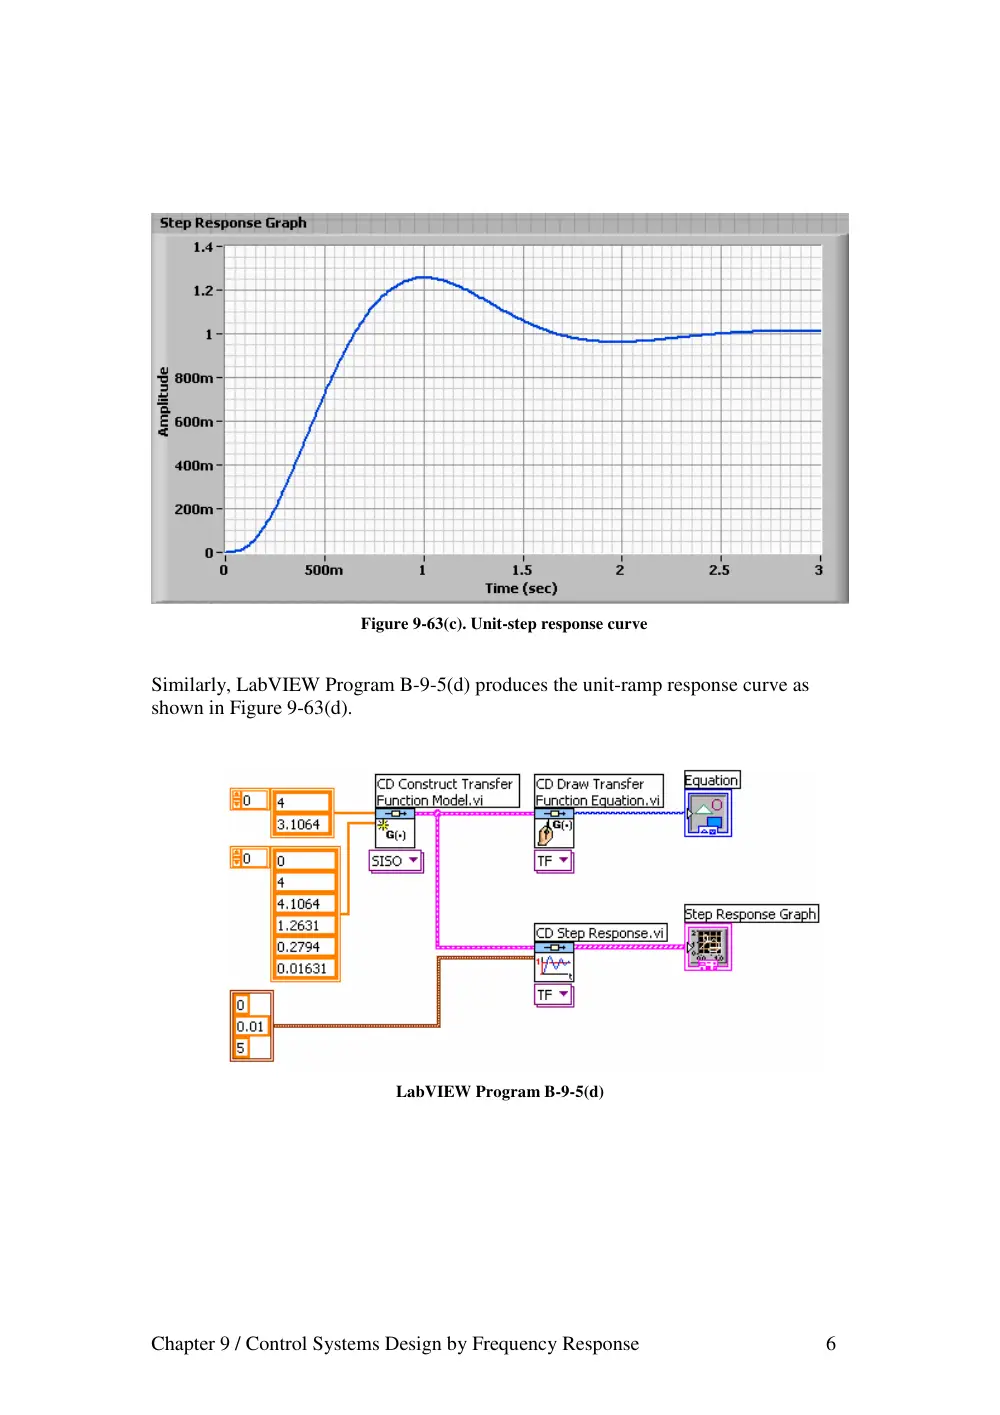
LabVIEW Program B-9-5(c) produces the unit-step response curve as shown in
Figure 9-63(c).
LabVIEW Program B-9-5(c)
Chapter 9 / Control Systems Design by Frequency Response 6
Figure 9-63(c). Unit-step response curve
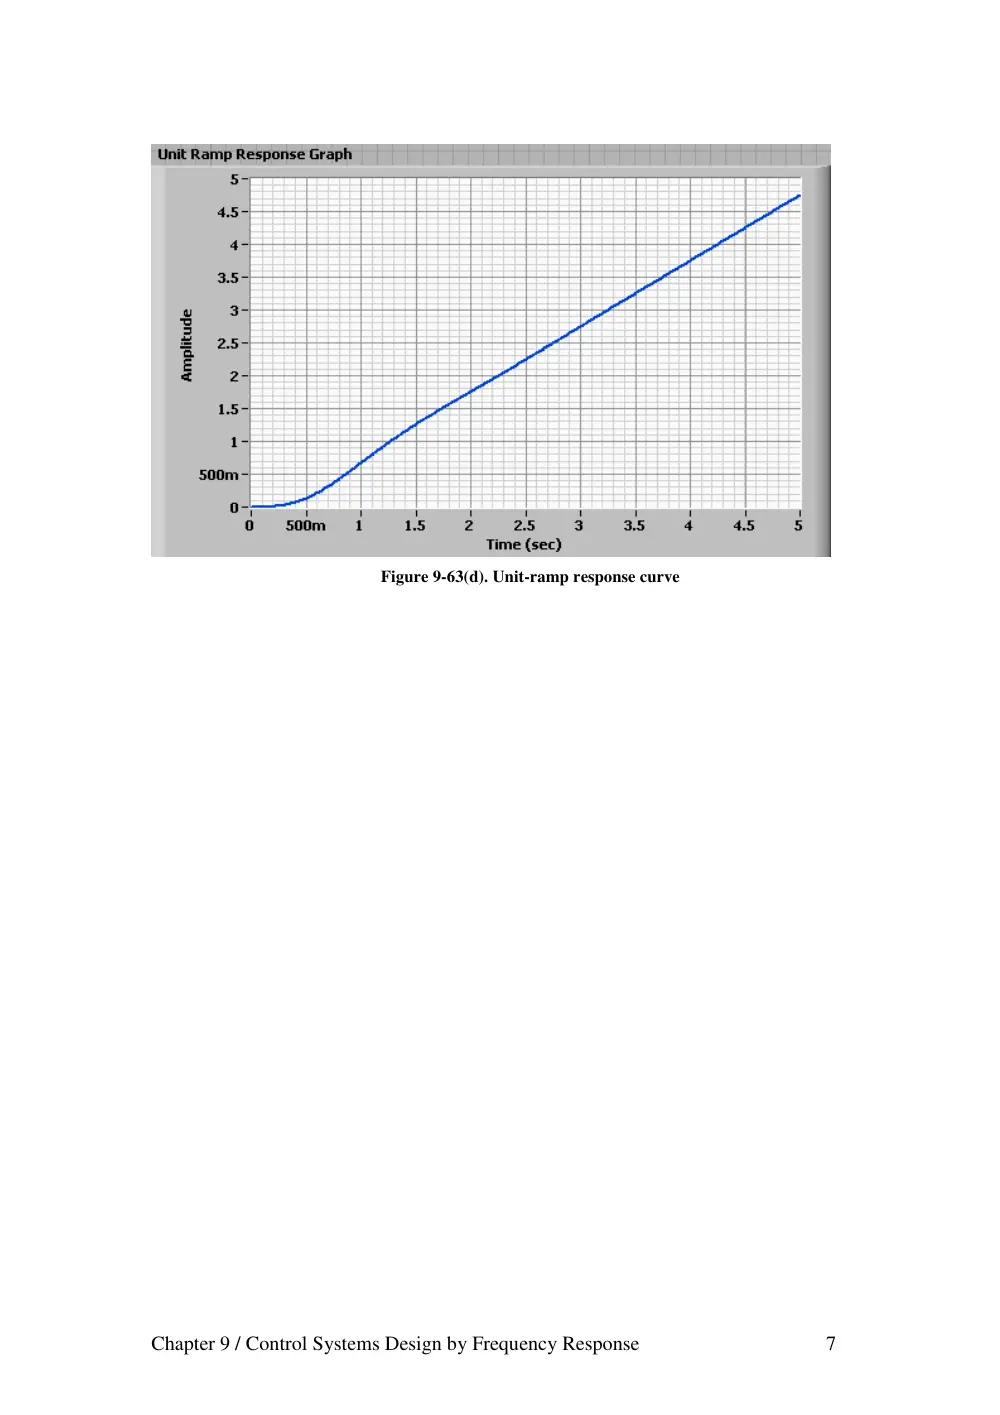
Similarly, LabVIEW Program B-9-5(d) produces the unit-ramp response curve as
shown in Figure 9-63(d).
LabVIEW Program B-9-5(d)
Chapter 9 / Control Systems Design by Frequency Response 7
Figure 9-63(d). Unit-ramp response curve
Chapter 9 / Control Systems Design by Frequency Response 1
Example B-9-6
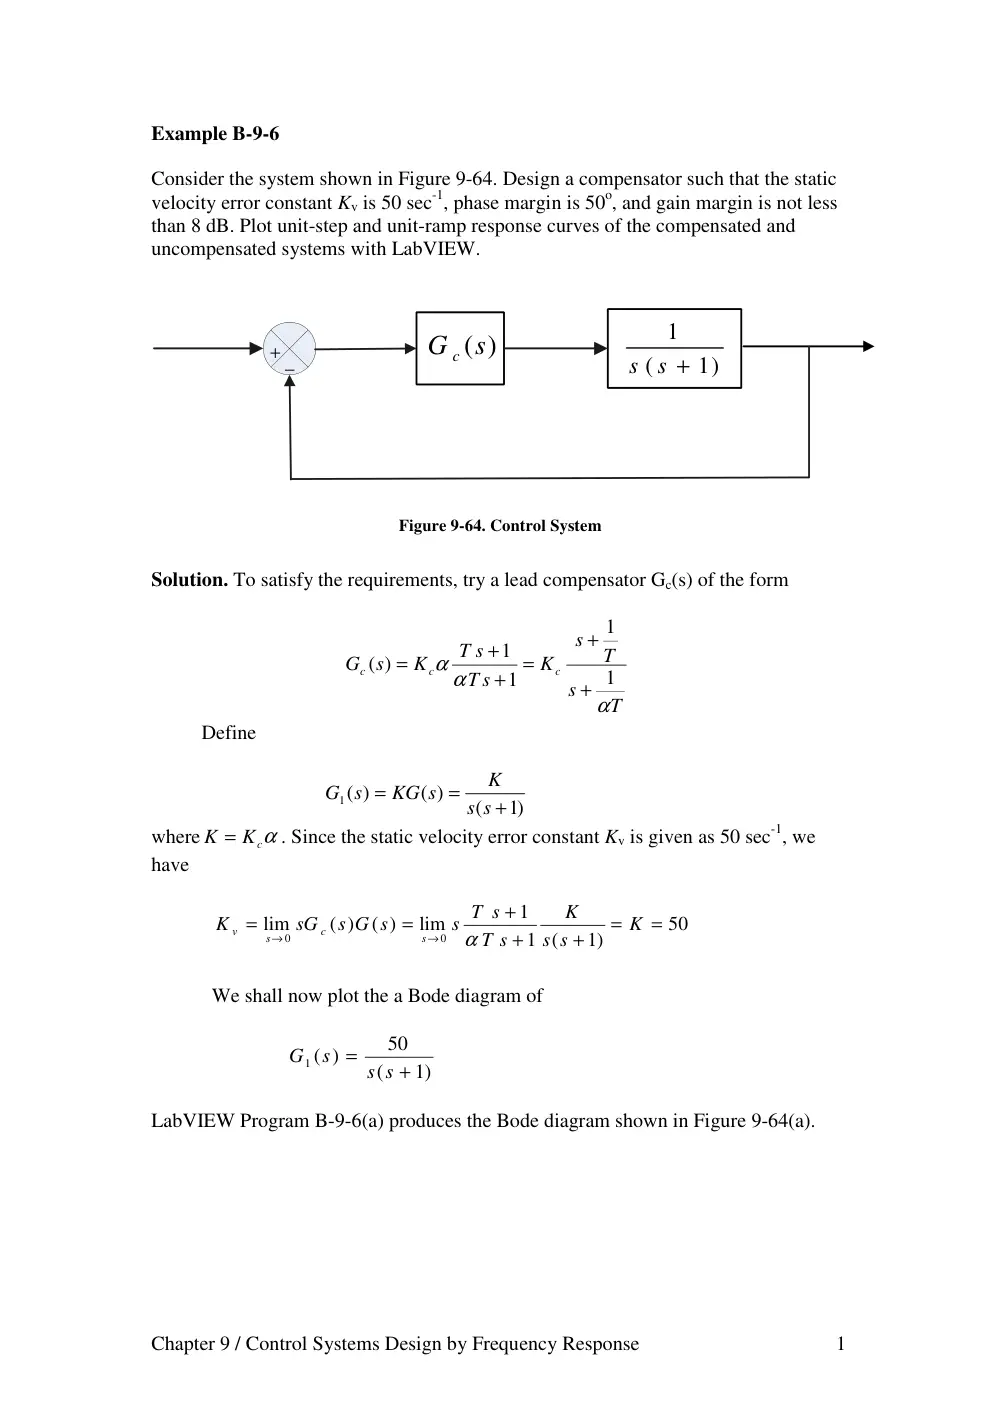
Consider the system shown in Figure 9-64. Design a compensator such that the static
velocity error constant Kv is 50 sec-1, phase margin is 50o, and gain margin is not less
than 8 dB. Plot unit-step and unit-ramp response curves of the compensated and
uncompensated systems with LabVIEW.
+
−
1)
(
1
s s +
(s)
G c
Figure 9-64. Control System
Solution. To satisfy the requirements, try a lead compensator Gc(s) of the form
T
s
T
s
K
T s
T s
K
s
G
c
c
c
α
α α
1
1
1
1
( )
+
+
=
+
+
=
Define
)1
(
( )
1 ( )
+
=
=
s s
K
KG s
G s
where
K = Kcα
. Since the static velocity error constant Kv is given as 50 sec-1, we
have
50
1)
1 (
1
lim
( )
( )
lim
0
0
=
=
+
+
+
=
=
→
→
K
s s
K
T s
s T s
s G s
sG
K
s
c
s
v
α
We shall now plot the a Bode diagram of
1)
(
50
)
1 (
+
=
s s
s
G
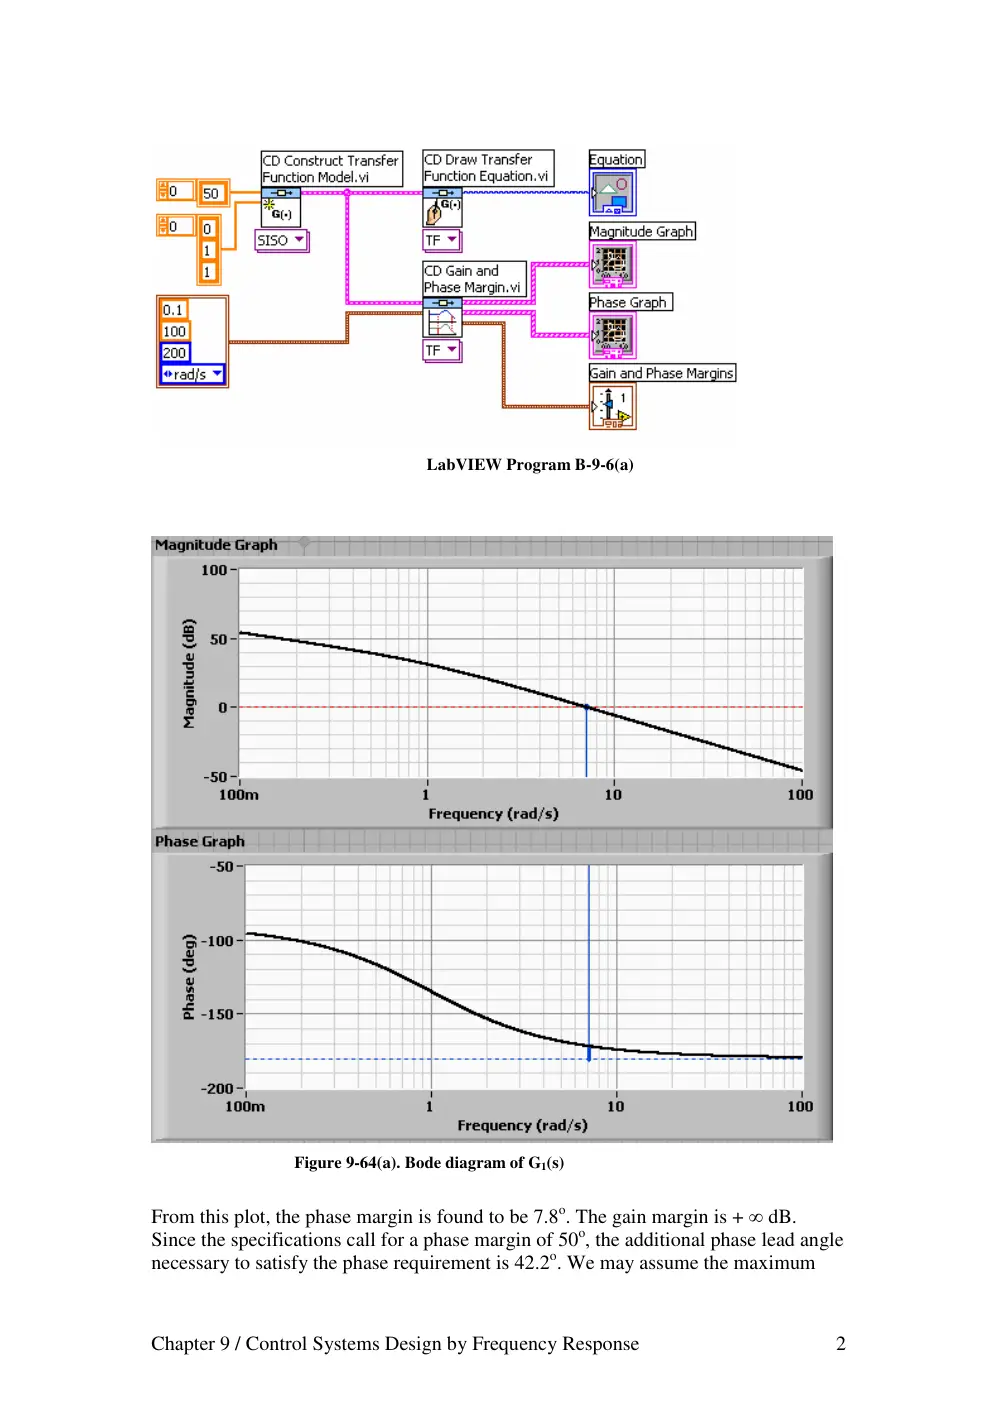
LabVIEW Program B-9-6(a) produces the Bode diagram shown in Figure 9-64(a).
Chapter 9 / Control Systems Design by Frequency Response 2
LabVIEW Program B-9-6(a)
Figure 9-64(a). Bode diagram of G1(s)
From this plot, the phase margin is found to be 7.8o. The gain margin is + ∞ dB.
Since the specifications call for a phase margin of 50o, the additional phase lead angle
necessary to satisfy the phase requirement is 42.2o. We may assume the maximum
Chapter 9 / Control Systems Design by Frequency Response 3
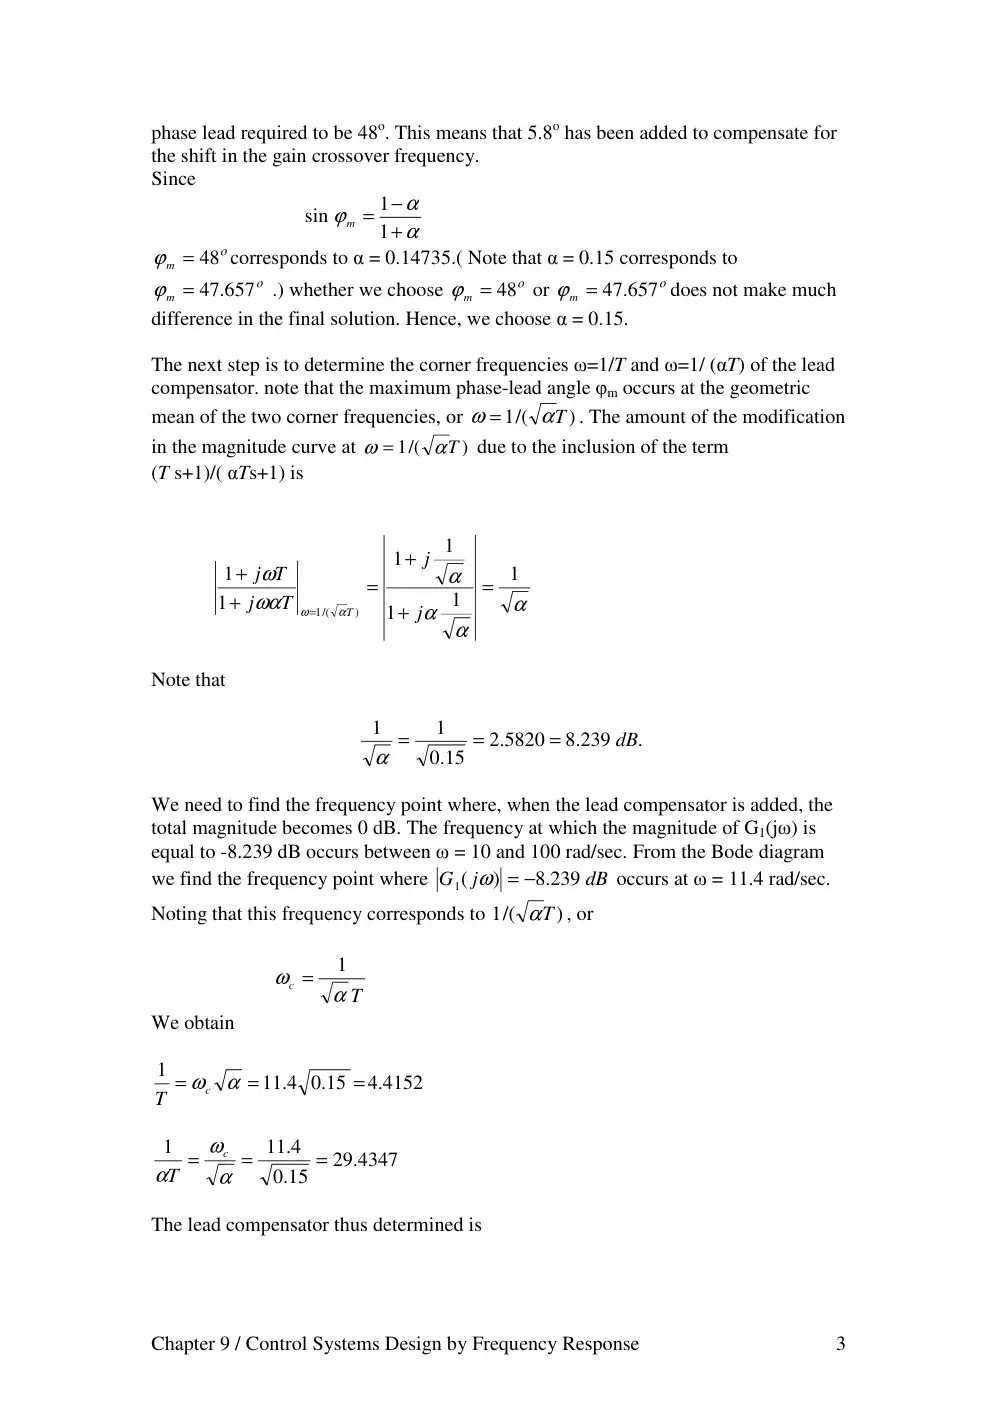
phase lead required to be 48o. This means that 5.8o has been added to compensate for
the shift in the gain crossover frequency.
Since
α
α
ϕ
+
−
= 1
1
sin
m
ο
ϕ
m = 48
corresponds to α = 0.14735.( Note that α = 0.15 corresponds to
ο
ϕ
m = 47.657
.) whether we choose
ο
ϕ
m = 48
or
ο
ϕ
m = 47.657
does not make much
difference in the final solution. Hence, we choose α = 0.15.
The next step is to determine the corner frequencies ω=1/T and ω=1/ (αT) of the lead
compensator. note that the maximum phase-lead angle φm occurs at the geometric
mean of the two corner frequencies, or
)
1/(
αT
ω =
. The amount of the modification
in the magnitude curve at
)
1/(
αT
ω =
due to the inclusion of the term
(T s+1)/( αTs+1) is
α
α
α
α
ωα
ω
α
ω
1
1
1
1
1
1
1
)
1/(
=
+
+
=
+
+
=
j
j
T
j
T
j
T
Note that
.
.8 239
.2 5820
15
.0
1
1
dB
=
=
=
α
We need to find the frequency point where, when the lead compensator is added, the
total magnitude becomes 0 dB. The frequency at which the magnitude of G1(jω) is
equal to -8.239 dB occurs between ω = 10 and 100 rad/sec. From the Bode diagram
we find the frequency point where
dB
j
G
.8 239
)
1(
= −
ω
occurs at ω = 11.4 rad/sec.
Noting that this frequency corresponds to
)
1/(
αT
, or
T
c
α
ω
1
=
We obtain
.4 4152
.0 15
11 4.
1
=
=
=
ωc α
T
29.4347
15
.0
11 4.
1
=
=
=
α
ω
α
c
T
The lead compensator thus determined is
Chapter 9 / Control Systems Design by Frequency Response 4
29.4347
.4 4152
1
1
( )
+
+
=
+
+
=
s
s
K
T
s
T
s
K
s
G
c
c
c
α
Where Kc is determined as
3
1000
.0 15
= α = 50 =
K
K c
Thus,
1
03397
.0
1
.0 2265
50
.4347
29
4152
.4
3
1000
( )
+
+
=
+
+
=
s
s
s
s
Gc s
LabVIEW Program B-9-6(b) produces the Bode diagram of the lead compensator just
designed, as shown in Figure 9-64(b).
LabVIEW Program B-9-6(b)
Chapter 9 / Control Systems Design by Frequency Response 5
Figure 9-64(b). Bode Diagram of Gc(s)
The open-loop transfer function of the designed system is
)1
(
1
29.4347
.4 4152
3
1000
( )
( )
+
+
+
=
s s
s
s
Gc s G s
LabVIEW Program B-9-6(c) produces the Bode diagram of Gc(s)G(s),which is shown
in Figure 9-64(c).
Chapter 9 / Control Systems Design by Frequency Response 6
LabVIEW Program B-9-6(c)
Figure 9-64(c). Bode diagram of Gc(s)G(s),
From this diagram, it is clearly seen that the phase margin is approximately 52o, the
gain margin is
+ ∞
dB, and Kv = 50 sec-1 ; all specifications are met.
Chapter 9 / Control Systems Design by Frequency Response 7
Next we shall obtain the unit-step and unit-ramp responses of the original
uncompensated system and the compensated system. The original uncompensated
system has the following closed-loop transfer function:
1
1
( )
)
(
2
+
+
=
s
s
R s
C s
The closed-loop transfer function of the compensated system is
4415 2.
1088.3041
91.3041
3
4415 2.
1000
.4 4152)
1000(
)1
29.4347) (
3(
.4 4152)
1000(
( )
)
(
2
3
+
+
+
+
=
+
+
+
+
+
=
s
s
s
s
s
s s
s
s
R s
s
C
The closed-loop poles of the compensated system are as follows:
.8 0804
.7 536
.1772
11
.7 5636
.1772
11
= −
−
−
=
+
−
=
s
j
s
j
s
LabVIEW Program B-9-6(d) produces the unit-step responses of the uncompensated
and compensated systems. The resulting response curves are shown in Figure 9-64(d).
LabVIEW Program B-9-6(d)
Chapter 9 / Control Systems Design by Frequency Response 8
Figure 9-64(d). Unit-step responses of the uncompensated and compensated systems.
LabVIEW Program B-9-6(e) produces the unit-ramp responses of the uncompensated
system and compensated system. The resulting response curves are shown in Figure
9-64(e).
LabVIEW Program B-9-6(e)
Chapter 9 / Control Systems Design by Frequency Response 9
Figure 9-64(e). Unit-ramp responses of the Uncompensated and Compensated systems.
Chapter 9 / Control Systems Design by Frequency Response 1
Example B-9-7
Consider the system shown in Figure 9-65. Design a compensator such that the static
velocity error constant is 4 sec-1, phase margin is 50o, and gain margin is 10 dB or
more. Plot unit-step and unit-ramp response curves of the compensated system with
LabVIEW. Also, draw a Nyquist plot of the compensated system with LabVIEW.
+
−
1
.1
0
2 +
+
s
s
(s)
G c
Figure 9-65. Control System
Solution.
Since the plant does not have an integrator, it is necessary to add an integrator in the
compensator. Let us choose the compensator to be
( )
( )
s
s G
K
s
G
c
c
=
,
( ) 1
lim
^
0
=
→
s
G c
s
Where
)
(
^
G c s
is to be determined later. Since the static velocity error constant is
specified as 4 sec-1, we have
4
1.0
1
1.0
( )
lim
1
1.0
( )
lim
2
^
0
2
0
=
=
+
+
=
+
+
=
→
→
K
s
s s
s G
K
s
s
s s
sG
K
c
s
c
s
v
Thus, K = 40. Hence
( )
40
)
(
^
s
s G
G s
c
=
Next, we plot a Bode diagram of
)1
(
)1.0
40(
)
(
2 +
+
=
s s
s
G s
LabVIEW Program B-9-7(a) produces a Bode diagram of G(s) as shown in
Figure 9-65(a).
Chapter 9 / Control Systems Design by Frequency Response 2
LabVIEW Program B-9-7(a)
Figure 9-65(a). Bode diagram of G(s)
We need the phase margin of 50o and gain margin of 10 dB or more. Let us choose
)
(
^
G c s
to be
0)
(
1
)
(
^
>
+
=
a
a s
G c s
Chapter 9 / Control Systems Design by Frequency Response 3
Then Gc(s) will contribute up to 90o phase lead in the high frequency region. By
simple trials, we find that a = 0.1526 gives the phase margin of 50o and gain margin
of
+ ∞
dB. LabVIEW Program B-9-7(b) produces the Bode diagram of
^
( )
( )
s
G s G
c
which is shown in Figure 9-65(b). From this Bode diagram we see that the
static velocity error constant is 4 sec-1, phase margin is 50o, and gain margin is
+ ∞
dB. Therefore the designed system satisfies all the requirements.
LabVIEW Program B-9-7(b)
Chapter 9 / Control Systems Design by Frequency Response 4
Figure 9-65(b). Bode diagram of
^
( )
( )
s
G s G
c
The designed compensator has the following transfer function
s
s
s
s G
s
G
c
c
)1
40( .0 1526
( )
40
)
(
^
+
=
=
The open-loop transfer function of the designed system is
)1
(
4
40.6104
104
.6
)1
(
)1.0
)1 (
( .0 1526
40
2
2
2
+
+
+
=
+
+
+
=
−
s s
s
s
s
s
s
s
loop transfer function
Open
We shall next check the unit-step response and the unit-ramp response of the designed
system. The closed-loop transfer function is
Chapter 9 / Control Systems Design by Frequency Response 5
4
41.6104
.6 104
4
40.6104
.6 104
( )
)
(
2
3
2
+
+
+
+
+
=
s
s
s
s
s
R s
C s
The closed-loop poles are located at
.0 0975
.5 6573
0032
.3
.5 6573
0032
.3
=−
−
−
=
+
−
=
s
j
s
j
s
LabVIEW Program B-9-7(c) will produce the unit-step curve of the designed system.
The resulting unit-step response curve is shown in Figure 9-65(c). Notice that the
closed-loop pole at s = -0.0975 and the plant zero at s = -0.1 produce the long tail of
small amplitude.
LabVIEW Program B-9-7(c)
Figure 9-65(c). Unit-step curve of the designed system
Chapter 9 / Control Systems Design by Frequency Response 6
LabVIEW Program B-9-7(d) produces the unit-ramp response curve of the designed
system. The resulting response curve is shown in Figure 9-65(d).
LabVIEW Program B-9-7(d)
Figure 9-65(d). Unit-ramp curve of the designed system.
Nyquist plot: Define the open-loop transfer function as G(s). Then
)1
(
4
40.6104
.6 104
1
1.0
( )
( )
2
2
2
+
+
+
=
+
+
=
s s
s
s
s
s s
G
G s
c
Let us choose a modified Nyquist path in the s-plane as shown in Figure (a) below.
The modified path encloses three open-loop poles (s = 0, s = j1, s = -j1). Then the
Chapter 9 / Control Systems Design by Frequency Response 7
Nyquist path becomes as shown in Figure (b) below. In the s1 plane, the open-loop
transfer function has three poles in the right-half s1 plane.
Let us choose
.0 01.
σo =
Since s =
o
s
1 −σ
, we have
G(s) = g(s1-0.01)
Open-loop transfer function in the s1 plane
.0 010001
.1 0003
03
.0
.3 5945064
40.48832
104
.6
.1 0001
.0 02
.0 01)(
(
4
.0 01)
40.6104(
.0 0001)
.0 02
104(
.6
1
2
1
3
1
1
2
1
1
2
1
1
1
1
2
1
−
+
−
+
+
=
+
−
−
+
−
+
+
−
=
s
s
s
s
s
s
s
s
s
s
s
Chapter 9 / Control Systems Design by Frequency Response 8
LabVIEW Program B-9-7(e) is used to obtain the Nyquist plot shown in
Figure 9-65(e).
LabVIEW Program B-9-7(e)
Figure 9-65(e). Nyquist plot
Chapter 9 / Control Systems Design by Frequency Response 1
Example B-9-8
Consider the system shown in Figure 9-66. It is desired to design a compensator such
that the static velocity error constant is 4 sec-1, phase margin is 50o, and gain margin is
8 dB or more. Plot the unit-step and unit-ramp response curves of the compensated
system with LabVIEW.
+
−
4
1.0
1.0
2
2
+
+
+
s
s
s
G c (s)
s
1
1
R
Hydraulic
Servo
Aircraft
Rate gyro
C
Figure 9-66. Control System
Solution:
The plant transfer function is
4)
0 1.
(
0 1.
2
)
(
2
+
+
+
=
s
s s
s
G s
The plant involves a quadratic term with
ς = .0 025
. This term is quite oscillatory.
LabVIEW Program B-9-8(a) produces the Bode diagram of G(s) as shown in
Figure 9-66(a).
LabVIEW Program B-9-8(a)
Chapter 9 / Control Systems Design by Frequency Response 2
Figure 9-66(a). Bode diagram of G(s)
The closed-loop transfer function of the original uncompensated system is
1.0
6
1.0
1.0
2
( )
)
(
2
3
+
+
+
+
=
s
s
s
s
R s
C s
The closed-loop poles of the uncompensated system are
.0 0167
.2 4489
0417
.0
.2 4489
0417
.0
=−
−
−
=
+
−
=
s
j
s
j
s
LabVIEW Program B-9-8(b) is used to obtain the unit-step response of this original,
uncompensated system. The resulting unit-step response curve is shown in
Figure 9-66(b).
Chapter 9 / Control Systems Design by Frequency Response 3
LabVIEW Program B-9-8(b)
Figure 9-66(b). Unit-step response of uncompensated system
To design a compensator for such a system, it is desirable to cancel the zero of the
plant, since it is located very close to the origin. It is some-times useful to include
double zero and double pole in the compensator. So, we may choose the compensator
to be
1.0
2
10)
(
2)
(
( )
2
2
+
+
+
+
=
s
a
s
s
s
K
s
G
c
c
.
Where we have chosen the double zero at s = -2 and double pole at s = -10. The value
of a is to be determined later. Since the static velocity error constant is specified as
4 sec-1, we have
Chapter 9 / Control Systems Design by Frequency Response 4
4
100
4)
1.0
(
1.0
2
1.0
2
10)
(
2)
(
lim
( )
( )
lim
2
2
2
0
0
=
=
+
+
+
+
+
+
+
=
=
→
→
a
K
s
s s
s
s
a
s
s
s
s K
s G s
sG
K
c
c
s
c
s
v
Hence,
K c a =400
By several trials we find a = 4 will give satisfactory results. Therefore, we choose
a = 4 and Kc = 100. Then, the transfer function of the compensator becomes
1.0
2
4
10)
(
2)
( ) 100 (
2
2
+
+
+
+
=
s
s
s
s
Gc s
The open-loop transfer function becomes as follows:
s
s
s
s
s
s
s
s
s
s s
s
s
s
s G s
Gc
400
90
106
1.
20
1600
2000
800
100
4)
1.0
(
10)
(
4)
2) (
100(
( )
)
(
2
3
4
5
2
3
2
2
2
+
+
+
+
+
+
+
=
+
+
+
+
+
=
LabVIEW Program B-9-8(c) produces the Bode diagram of Gc(s)G(s). The resulting
Bode diagram is shown in Figure 9-66(c).
LabVIEW Program B-9-8(c)
Chapter 9 / Control Systems Design by Frequency Response 5
Figure 9-66(c). Bode diagram of Gc(s)G(s).
From this Bode diagram, it is seen that Kv = 4 sec-1, phase margin is +∞ dB. So, all
the requirements are met.
The closed-loop transfer function of the compensated system becomes as follows:
1600
2400
890
206
20 1.
1600
2000
800
100
( )
)
(
2
3
4
5
2
3
+
+
+
+
+
+
+
+
=
s
s
s
s
s
s
s
s
R s
C s
The closed-loop poles of the compensated system can be found as follows.
Chapter 9 / Control Systems Design by Frequency Response 6
LabVIEW Program B-9-8(d) produces the unit-step response of the designed system.
The unit-step response curve is shown in Figure 9-66(d).
LabVIEW Program B-9-8(d)
Figure 9-66(d). Unit-step response of the designed system.
LabVIEW Program B-9-8(e) produces the unit-ramp response of the compensated
system. The unit-ramp response curve is shown in Figure 9-66(e).
Note the use of the Polynomial Roots VI
which finds the roots of the polynomial P(x).
Chapter 9 / Control Systems Design by Frequency Response 7
LabVIEW Program B-9-8(e)
Figure 9-66(e). Unit-ramp response of the compensated system.
It is noted that there are infinitely many possible compensators for this system. A few
possible compensators are shown below.
)1.0
25)(2
(
)1
(
400
)
(
2
+
+
+
=
s
s
s
Gc s
)1.0
20)(2
(
)1
(
) 320
(
2
+
+
+
=
s
s
s
Gc s
Chapter 9 / Control Systems Design by Frequency Response 8
1333
.0
1
30
4
160
( )
+
+
+
+
=
s
s
s
s
Gc s
.32
74
.9 81
1212.12
( )
+
+
=
s
s
Gc s
Chapter 9 / Control Systems Design by Frequency Response 1
Example B-9-9
Consider the system shown in Figure 9-67. Design a lag-lead compensator such that
the static velocity error constant Kv is 20 sec-1, phase margin is 60o, and gain margin is
not less than 8 dB. Plot the unit-step and unit-ramp response curves of the
compensated system with LabVIEW.
+
−
5)
1)(
(
1
+
+
s
s s
(s)
G c
Figure 9-67. Control System
Solution.
Let us assume that the compensator Gc(s) has the following form
1 )
)(
(
1 )
1 )(
(
)1
1)(
(
)1
1)(
(
)
(
2
1
2
1
2
1
2
1
T
s
T
s
T
s
T
s
K
T s
T s
T s
T s
K
s
G
c
c
c
β
β
β
β
+
+
+
+
=
+
+
+
+
=
Since Kv is specified as 20 sec-1, we have
20
5
1
5)
1)(
(
1
( )
lim
0
=
=
+
+
=
→
c
c
s
v
K
s
s s s
sG
K
Hence
Kc = 100
Define
5)
1)(
(
100
( )
1 ( ) 100
+
+
=
=
s
s s
G s
G s
LabVIEW Program B-9-9(a) produces the Bode plot of G1(s) as shown in
Figure 9-67(a).
Chapter 9 / Control Systems Design by Frequency Response 2
LabVIEW Program B-9-9(a)
Figure 9-67(a). Bode plot of G1(s)
From this Bode diagram we find the phase crossover frequency to be ω = 2.25
rad/sec. Let us choose the gain crossover frequency of the designed system to be
ω = 2.25 rad/sec so that the phase lead angle required at ω = 2.25 rad/sec is 60o.
Chapter 9 / Control Systems Design by Frequency Response 3
Once we choose the gain crossover frequency to be 2.25 rad/sec, we can determine
the corner frequencies of the phase lag portion of the lag-lead compensator. Let us
choose the corner frequency 1/T2 to be one decade below the new gain crossover
frequency, or 1/T2 = 0.255. For the lead portion of the compensator, we first
determine the value of β that provides φm = 65o, (5o added to 60o.) Since
1
1
1
1
1
1
sin
+
−
=
+
−
=
β
β
β
β
φm
We find β = 20 corresponds to 64.7912o. Since we need 65o phase margin, we may
choose β = 20. Thus
β = 20
Then, the corner frequency 1/( βT2) of the phase lag portion becomes as follows:
.0 01125
20
225
.0
.0 225
1
20
1
1
2
=
=
=
x
βT
Hence, the phase lag portion of the compensator becomes as
1
.8889
88
1
.4 4444
20
01125
.0
.0 225
+
+
=
+
+
s
s
s
s
For the phase lead portion, we first note that
G1(j 2.25) = 10.35 dB.
If the lag-lead compensator contributes -10.35 dB at ω = 2.25 rad/sec, then the new
gain crossover frequency will be as desired. The intersections of the line with slope
+20 dB/dec [passing through the point (2.25,-10.35 dB)] and the 0 dB line and -
26.0206 dB line determine the corner frequencies. Such intersections are found as
ω = 0.3704 and ω = 7.4077 rad/sec, respectively.
Thus, the phase lead portion becomes
+
+
=
+
+
1
.0 1350
1
.2 6998
20
1
.7 4077
.0 3704
s
s
s
s
Hence the compensator can be written as
Chapter 9 / Control Systems Design by Frequency Response 4
+
+
+
+
=
+
+
+
+
=
077
.4.7
.0 3704
.0 01125
.0 225
100
1
.0 1350
1
.2 6998
1
88.8889
1
.4 4444
) 100
(
s
s
s
s
s
s
s
s
s
Gc
Then the open-loop transfer function Gc(s)G(s) becomes as follows:
s
s
s
s
s
s
s
s
s s
s
s
s
s
s
Gc
5
451.1195
595.1434
161.0239
12
100
714.42
.90
1199
5)
1)(
(
1
1
.0 1350
1
.2 6998
1
88.8889
1
.4 4444
) 100
(
2
3
4
5
2
+
+
+
+
+
+
=
+
+
+
+
+
+
=
LabVIEW Program B-9-9(b) produces the Bode diagram of the open-loop transfer
function. The resulting Bode diagram is shown in Figure 9-67(b).
LabVIEW Program B-9-9(b)
Chapter 9 / Control Systems Design by Frequency Response 5
Figure 9-67(b). Bode diagram of the open-loop transfer function.
To read the phase margin and gain margin precisely, we need to expand the diagram
between ω = 1 and ω = 10 rad/sec. This can be easily done by clicking on the first
value and final of ω in the graph and changing them to 1 and 10 respectively. The
resulting Bode diagram is shown in Figure 9-67(b1).
Chapter 9 / Control Systems Design by Frequency Response 6
Figure 9-67(b1). Expanded diagram of open-loop transfer function
From this diagram we find that the phase margin is approximately 60o and gain
margin is 14.35 dB. The static velocity error constant is 20 sec-1.
The closed-loop transfer function of the designed system is
100
719 4.
1651
595 1.
161
12
100
714.42
1199.90
( )
)
(
2
3
4
5
2
+
+
+
+
+
+
+
=
s
s
s
s
s
s
s
R s
C s
LabVIEW Program B-9-9(c) produces the unit-step response. The resulting unit-step
response curve is shown in Figure 9-67(c).
Chapter 9 / Control Systems Design by Frequency Response 7
LabVIEW Program B-9-9(c)
Figure 9-67(c). Unit-step response curve.
The closed-loop poles are:
Chapter 9 / Control Systems Design by Frequency Response 8
Notice that there are two zeros (s = -0.225 and s = -0.4939) near the closed-loop poles
at s = -0.246254 ± j0.107582. Such a pole-zero combination generates a long tail with
small amplitude in the unit-step response.
LabVIEW Program B-9-9(d) will produce the unit-ramp response as shown in
Figure 9-67(d).
LabVIEW Program B-9-9(d)
Figure 9-67(d). Unit-ramp response curve.