
CMPS 251 Homework Assignment 5, Fall 2015
American University of Beirut · Numerical Computing · 2 pages
More CMPS 251 files
- Homework Assignment 3 Solution · Fall 2015Homework · with solutionView
- Homework Assignment 4 · Fall 2015HomeworkView
- Homework Assignment 3 · Fall 2015HomeworkView
- Homework Assignment 4 Solution · Fall 2015Homework · with solutionView
- Homework Assignment 2 Solution · Fall 2015Homework · with solutionView
- Homework Assignment 1 · Fall 2015HomeworkView
- Homework Assignment 1 Solution · Fall 2015Homework · with solutionView
- Homework Assignment 2 · Fall 2015HomeworkView
Show the text of this homework
CMPS 251-Numerical Computing
Assignment 5
Due Monday, December 7, 2015
Reading Material:
- Cheney & Kincaid: Sections 5.1-5.3, 9.1
Notes: You are encouraged in work individually on the assignment. Piazza can be used to ask
questions (without requesting a solution !!).
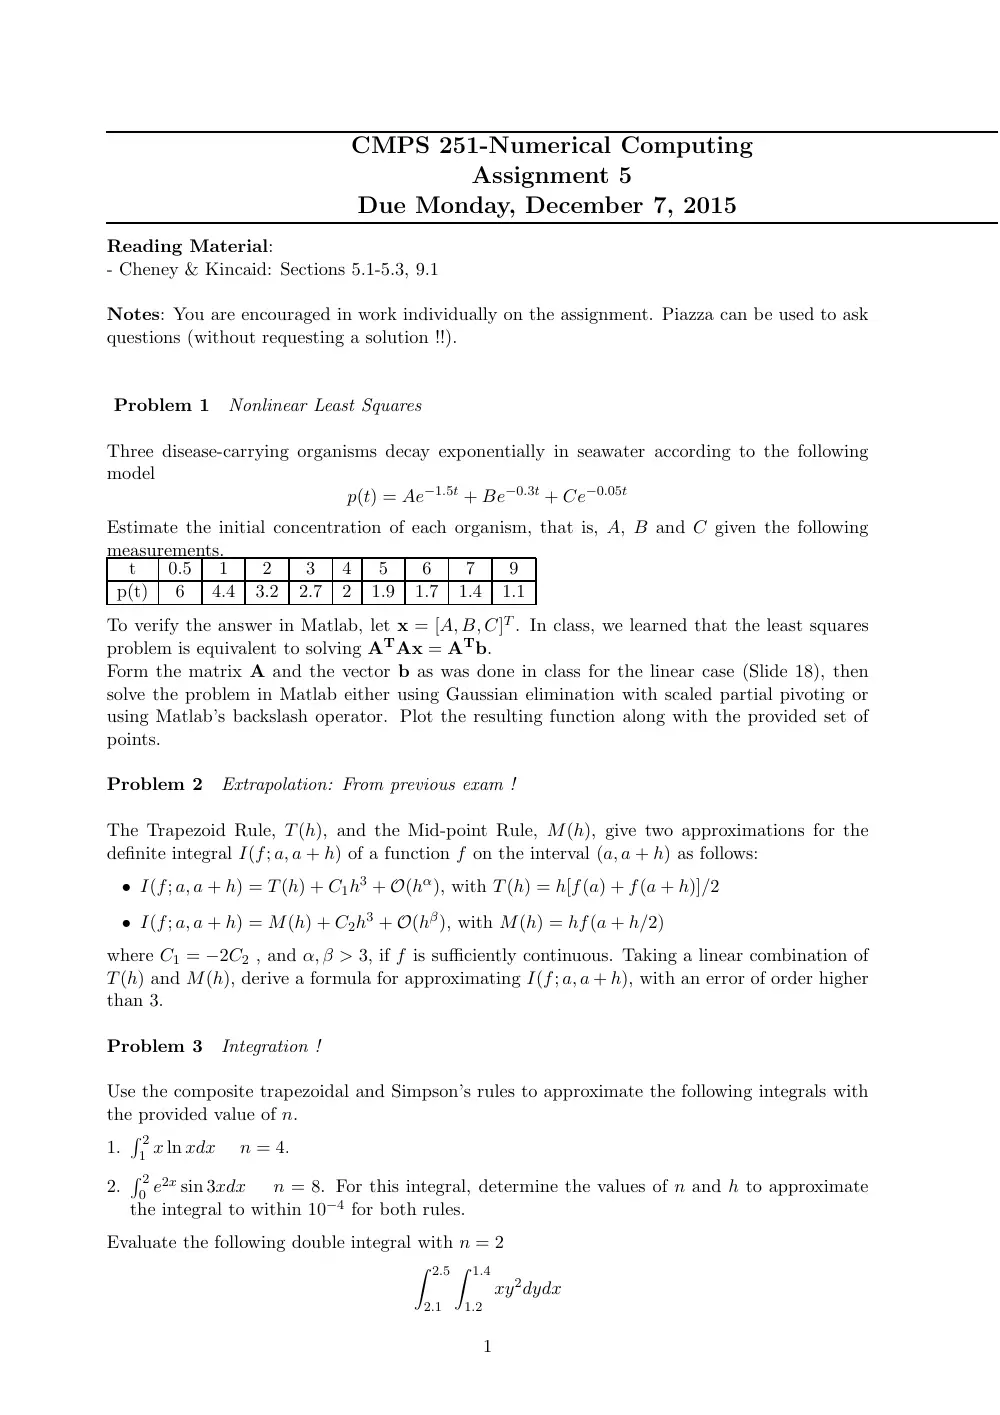
Problem 1
Nonlinear Least Squares
Three disease-carrying organisms decay exponentially in seawater according to the following
model
p(t) = Ae−1.5t + Be−0.3t + Ce−0.05t
Estimate the initial concentration of each organism, that is, A, B and C given the following
measurements.
t
0.5
1
2
3
4
5
6
7
9
p(t)
6
4.4
3.2
2.7
2
1.9
1.7
1.4
1.1
To verify the answer in Matlab, let x = [A, B, C]T . In class, we learned that the least squares
problem is equivalent to solving ATAx = ATb.
Form the matrix A and the vector b as was done in class for the linear case (Slide 18), then
solve the problem in Matlab either using Gaussian elimination with scaled partial pivoting or
using Matlab’s backslash operator. Plot the resulting function along with the provided set of
points.
Problem 2
Extrapolation: From previous exam !
The Trapezoid Rule, T(h), and the Mid-point Rule, M(h), give two approximations for the
definite integral I(f; a, a + h) of a function f on the interval (a, a + h) as follows:
• I(f; a, a + h) = T(h) + C1h3 + O(hα), with T(h) = h[f(a) + f(a + h)]/2
• I(f; a, a + h) = M(h) + C2h3 + O(hβ), with M(h) = hf(a + h/2)
where C1 = −2C2 , and α, β > 3, if f is sufficiently continuous. Taking a linear combination of
T(h) and M(h), derive a formula for approximating I(f; a, a + h), with an error of order higher
than 3.
Problem 3
Integration !
Use the composite trapezoidal and Simpson’s rules to approximate the following integrals with
the provided value of n.
1.
� 2
1 x ln xdx
n = 4.
2.
� 2
0 e2x sin 3xdx
n = 8. For this integral, determine the values of n and h to approximate
the integral to within 10−4 for both rules.
Evaluate the following double integral with n = 2
� 2.5
2.1
� 1.4
1.2
xy2dydx
1
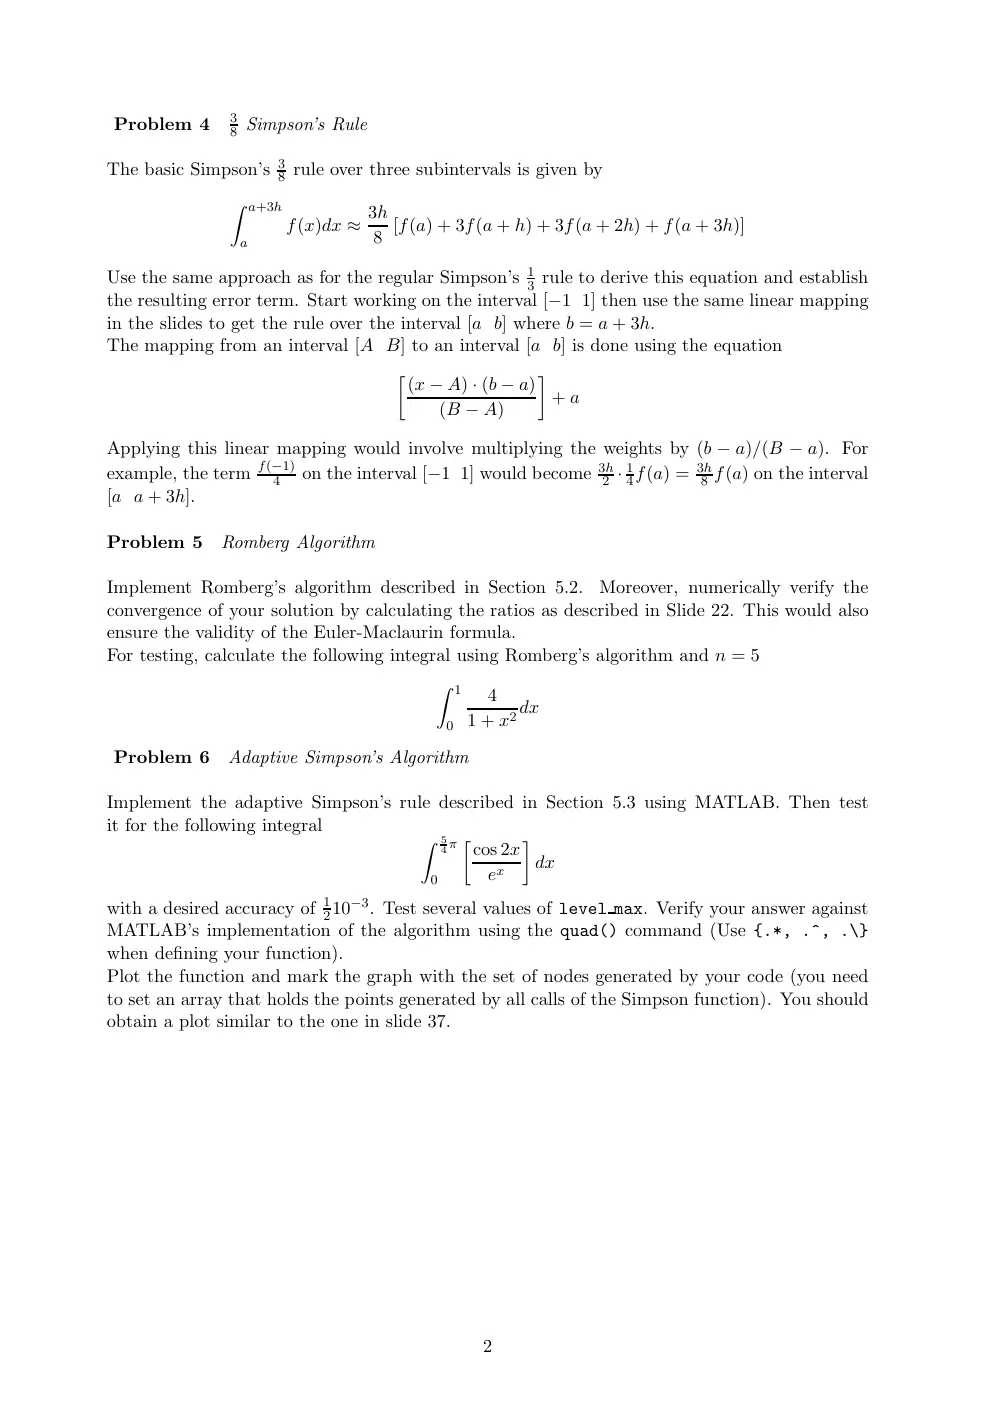
Problem 4
3
8 Simpson’s Rule
The basic Simpson’s 3
8 rule over three subintervals is given by
� a+3h
a
f(x)dx ≈ 3h
8 [f(a) + 3f(a + h) + 3f(a + 2h) + f(a + 3h)]
Use the same approach as for the regular Simpson’s 1
3 rule to derive this equation and establish
the resulting error term. Start working on the interval [−1 1] then use the same linear mapping
in the slides to get the rule over the interval [a b] where b = a + 3h.
The mapping from an interval [A B] to an interval [a b] is done using the equation
�(x − A) · (b − a)
(B − A)
�
+ a
Applying this linear mapping would involve multiplying the weights by (b − a)/(B − a). For
example, the term f(−1)
4
on the interval [−1 1] would become 3h
2 · 1
4f(a) = 3h
8 f(a) on the interval
[a a + 3h].
Problem 5
Romberg Algorithm
Implement Romberg’s algorithm described in Section 5.2.
Moreover, numerically verify the
convergence of your solution by calculating the ratios as described in Slide 22. This would also
ensure the validity of the Euler-Maclaurin formula.
For testing, calculate the following integral using Romberg’s algorithm and n = 5
� 1
0
4
1 + x2 dx
Problem 6
Adaptive Simpson’s Algorithm
Implement the adaptive Simpson’s rule described in Section 5.3 using MATLAB. Then test
it for the following integral
�
5
4π
0
�cos 2x
ex
�
dx
with a desired accuracy of 1
210−3. Test several values of level max. Verify your answer against
MATLAB’s implementation of the algorithm using the quad() command (Use {.*, .^, .\}
when defining your function).
Plot the function and mark the graph with the set of nodes generated by your code (you need
to set an array that holds the points generated by all calls of the Simpson function). You should
obtain a plot similar to the one in slide 37.
2