
MECH 430 Notes 4, Spring 2014
American University of Beirut · Instrumentation and Measurements · 45 pages
Showing the first 10 of 45 pages. Download the PDF to see all of it.
More MECH 430 files
Show the text of this notes
Instrumentation & Measurements
MECH 430
MECH 430
Slide 1
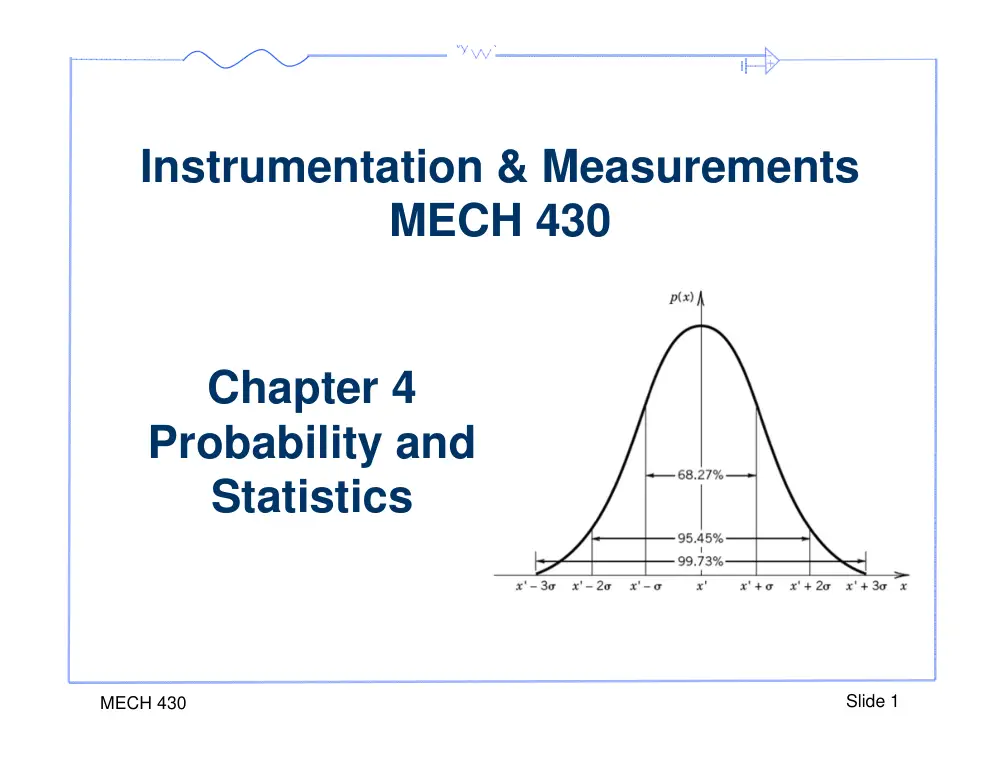
Chapter 4
Probability and
Statistics
4.1 Introduction
• For a given set of measurement, we want to be able to
quantify:
– A single representative value that best characterize the
average of the data set
– A representative value that provides a measure of the
variation in the measured data set
– How well the single average value represents the true
average value of the variable
MECH 430
Slide 2
4.1 Introduction
• In this chapter we will see:
– Statistical characteristics of a data set.
– Histogram of measured data
– Probability density functions to describe the behavior of a
variable.
– Confidence interval about the measured mean
– Perform regression analysis to quantify the confidence
interval
MECH 430
Sensor characteristics
Slide 3
4.2 Statistical Measurement
• A sample of data refers to a set of data obtained
during repeated measurements of a variable under
fixed operating conditions. Systematic errors are
considered zero.
• The measurement problem will try to estimate the
true value of the variable (x’), base on repeated
measurement of (x).
• The true value is the mean of all possible values of x.
MECH 430
Slide 4
Probability Density Functions
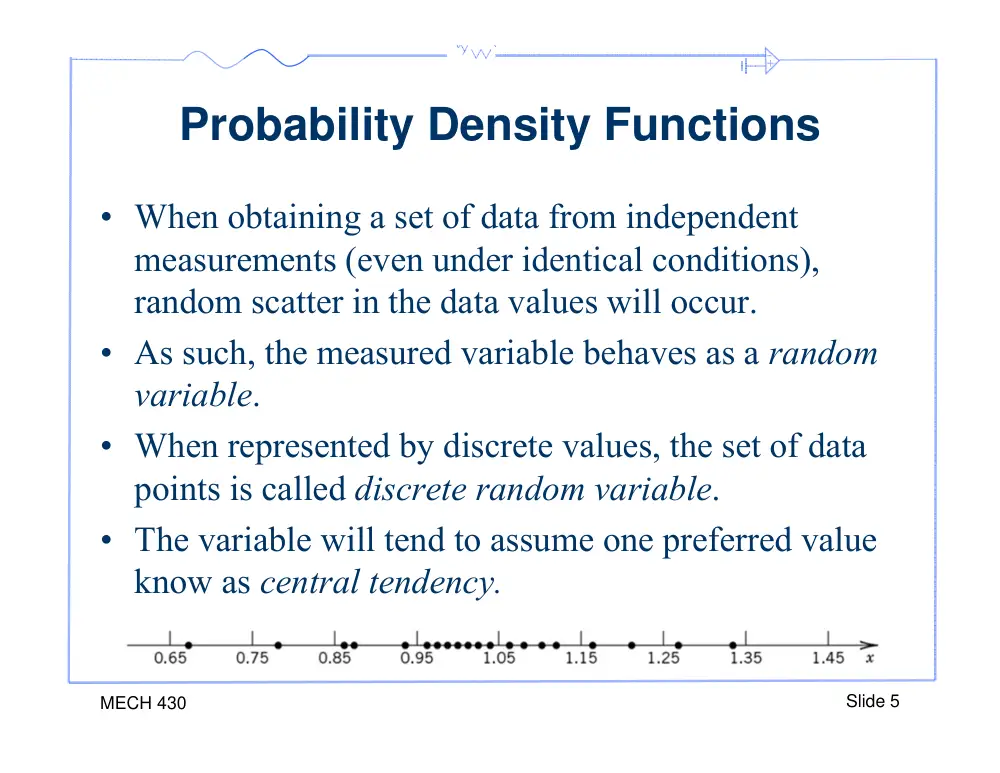
• When obtaining a set of data from independent
measurements (even under identical conditions),
random scatter in the data values will occur.
• As such, the measured variable behaves as a random
variable.
• When represented by discrete values, the set of data
points is called discrete random variable.
• The variable will tend to assume one preferred value
know as central tendency.
MECH 430
Slide 5
Probability Density Functions
• The frequency with which the measured variable
assumes a particular value or interval of values is
described by its probability density.
• The x axis is divided between the maximum and the
minimum measured values of x into K intervals.
• Let nj be the number of samples that falls in one
interval, and 2δx the width of the interval.
• For small number of samples, K should be chosen
such that nj >5 for at least one interval.
MECH 430
Slide 6
Probability Density Functions
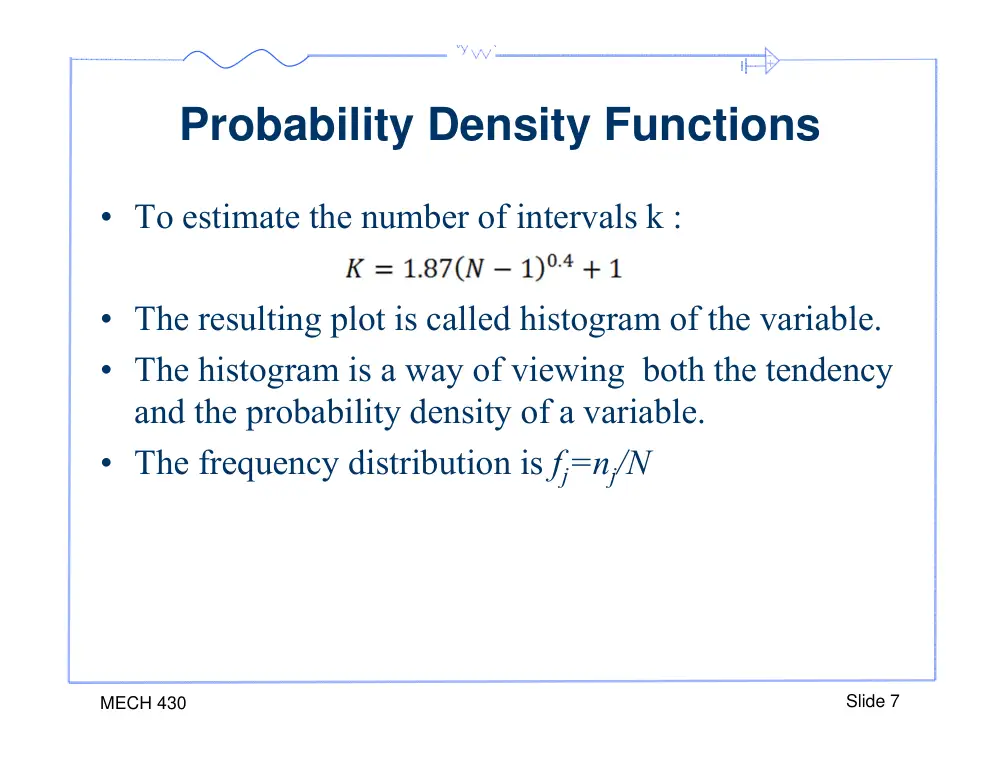
• To estimate the number of intervals k :
• The resulting plot is called histogram of the variable.
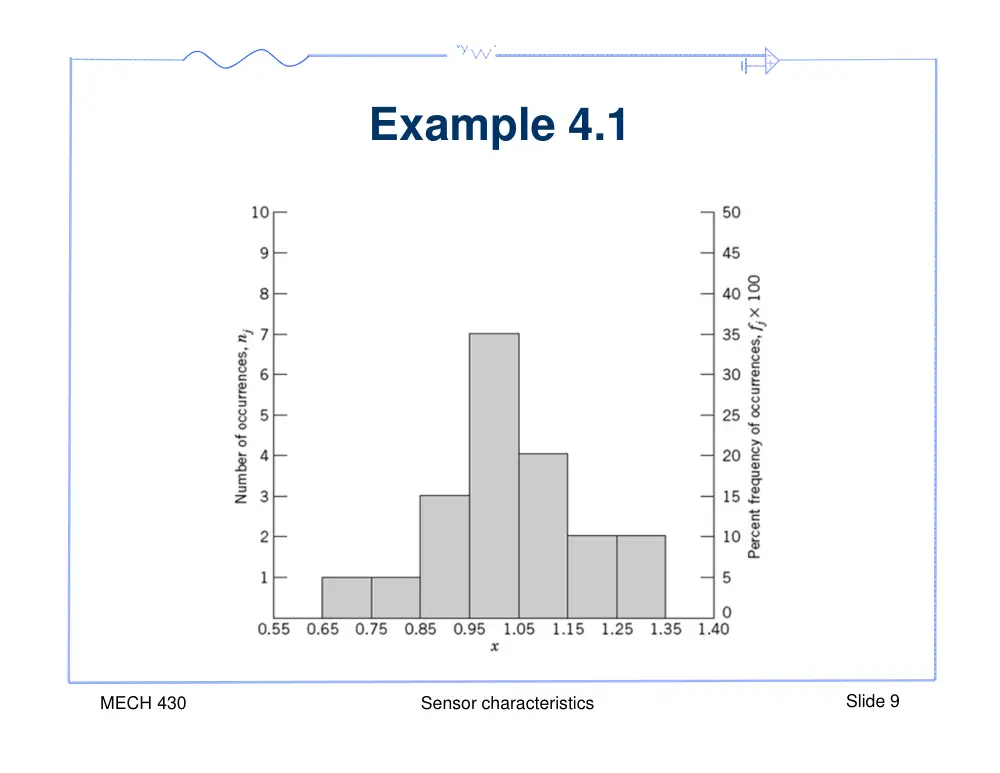
• The histogram is a way of viewing both the tendency
and the probability density of a variable.
• The frequency distribution is fj=nj/N
MECH 430
Slide 7
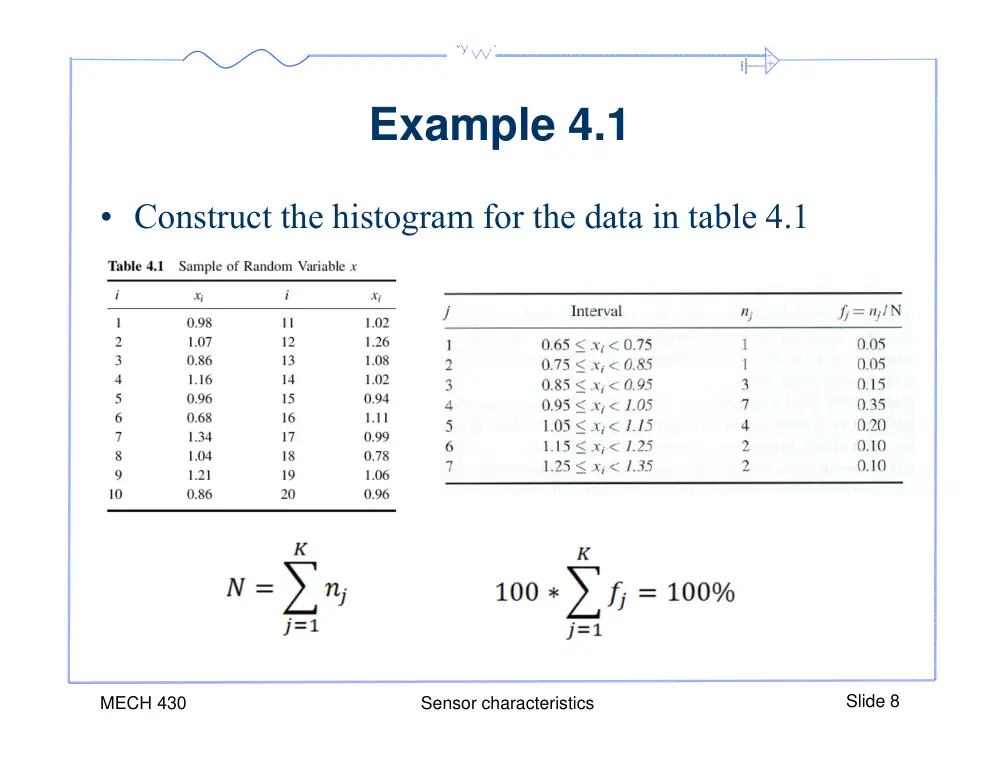
Example 4.1
• Construct the histogram for the data in table 4.1
MECH 430
Sensor characteristics
Slide 8
Example 4.1
MECH 430
Sensor characteristics
Slide 9
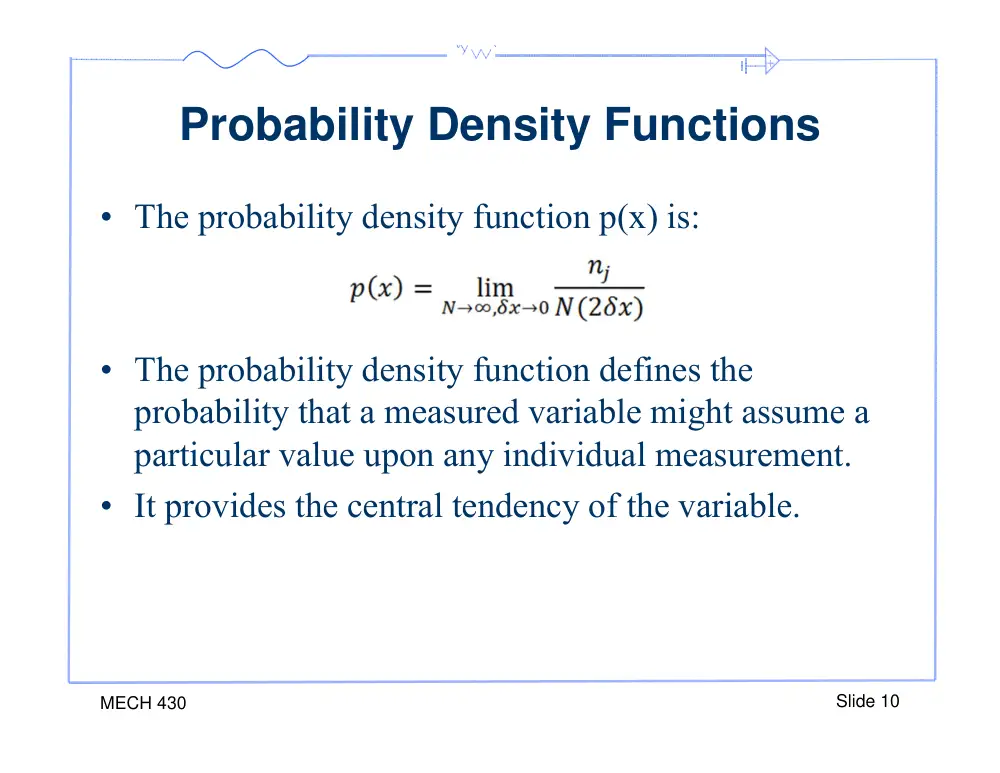
Probability Density Functions
• The probability density function p(x) is:
• The probability density function defines the
probability that a measured variable might assume a
particular value upon any individual measurement.
• It provides the central tendency of the variable.
MECH 430
Slide 10
Probability Density Functions
MECH 430
Slide 11
Probability Density Functions
• Regardless of the type of distribution assumed by a
variable, if the variable shows a central tendency, it
can be described and quantified through its mean and
variance.
• The standard deviation is defined as the square root of
the variance.
MECH 430
Slide 12
4.3 Infinite Statistics
• Many measurands common to engineering are
described by a normal or Gaussian distribution where
data will scatter symmetrically about some central
tendency.
• The PDF for a random variable x having a normal
distribution is:
where x’ is the true mean value and σ2 is the true
variance of x
MECH 430
Slide 13
4.3 Infinite Statistics
• The probability P(x) that the random variable x will
assume a value within the interval x’±δx is given by
the area under p(x).
• Using the following transformation:
MECH 430
Slide 14
P(x' x x x' x)
p(x)dx
x ' x
x ' x
4.3 Infinite Statistics
• The half value of the probability is tabulated for the
interval defined by z1.
• The probability that x have a value between x’±z1σ is
2P(z1)x100.
MECH 430
Slide 15
MECH 430
Slide 16
Example 4.3
• It is known that the statistics of a voltage signal are
given by x’=8.5v and σ2 =2.25V2. If a single
measurement of the voltage is made, determine the
probability that the measured value is between 10.0
and 11.5V.
MECH 430
Slide 17
4.3 Infinite Statistics
• Normal or Gaussian.
• The PDF for a random variable x having a normal
distribution is:
MECH 430
Slide 18
P(x' x x x' x)
p(x)dx
x ' x
x ' x
4.3 Infinite Statistics
• The probability that x is between x‘±z1σ is 2P(z1)x100.
MECH 430
Slide 19
MECH 430
Slide 20
Example
• A professor's exam scores are approximately distributed
normally with mean 80 and standard deviation 5.
• What is the probability that a student scores an 82 or
less?
Prob(X ≤ 82)
= Prob(Z ≤ (82-80)/5)
= Prob(Z ≤ .40) = 0.5 + 0.1554 = .6554
• What is the probability that a student scores a 90 or
more?
Prob(X ≥ 90)
= Prob(Z ≥ (90-80)/5)
= Prob(Z ≥ 2.00)
= 0.5 – 0.4772 = .0228
MECH 430
Slide 21
Example
• What is the probability that a student scores a 74 or
less?
Prob(X ≤ 74)
= Prob(Z ≤ (74-80)/5)
= Prob(Z ≤ -1.20)
• If your table does not have negatives, use:
Prob(Z ≤ -1.20) = Prob(Z ≥ 1.20) = 0.5 - .3849 = .1151
MECH 430
Slide 22
Example
• What is the probability that a student scores between 78
and 88?
Prob(78 ≤ X ≤ 88)
= Prob((78-80)/5 ≤ Z ≤ (88-
80)/5)
= Prob(-0.40 ≤ Z ≤ 1.60)
= Prob(Z ≤ 1.60) -Prob(Z ≤ -0.40)
= 0.4452 +0.1554= .6006
4.4 Finite Statistics
• If N measurements of x have been made and N is a
finite value, the statistical value obtained from such
data set will be regarded as estimates of the true
values.
• Finite sized data sets can provide the statistical
estimates know as the sample mean value, the sample
variance and the sample standard deviation.
MECH 430
Slide 23
4.4 Finite Statistics
• While infinite statistics (what we have seen so far)
describes the true behavior of a variable, finite
statistics describes the behavior of the finite data set.
• Here we talk about:
– The sample mean,
– The sample variance,
– The sample standard deviation
MECH 430
Slide 24
x 1
N
xi
i1
N
Sx
2
1
N 1
xi x
i1
N
2
Sx
1
N 1
xi x
2
i1
N
1/2
4.4 Finite Statistics
• The degrees of freedom in the data set “v” is given as
N-1.
• The predictive utility of infinite statistics can be
extended to data sets for finite sample size with some
modification.
• For finite sets, the z variable does not provide a
reliable weight estimate.
• To compensate for the difference, the sample variance
is weighted as follows:
MECH 430
Slide 25
4.4 Finite Statistics
• When sample sizes are small (N < 31 ) the z variable is
not accurate. Instead we use the student t distribution.
MECH 430
Slide 26
xi x tv,PSx (P%)
t testimator
v is the number of degrees of freedom (N-1)
P is the desired probability
4.4 Finite Statistics
MECH 430
Slide 27
Example 4.4
• Consider the data in the table below. Compute the
sample statistics for this set. Estimate the interval of
values over which 95% of the measurements should
be expected to lie.
MECH 430
Slide 28
• Mean x = 1.02
• Standard deviation Sx = 0.16
• Given the probability 95%, find the corresponding
range of data, in other words determined xi
• ti = (xi – x)/Sx gives xi = Sx*ti + x
• For this example,
x19,95 = Sx*t19,95 + x
From the Student’s t distribution table, t19,95 = 2.093
thus x19,95 = 0.16*2.093 + 1.02 = 0.33 + 1.02
Interval in which 95% of the data would lie is:1.02 +/- 0.33
MECH 430
Slide 29
Example 4.4 (cont.)
Standard Deviation of the Means
• Each time we take a new sample we expect a different
mean and standard deviation.
• The set of mean values will be normally distributed
about a central value, even if the PDF of the original
function is not itself normal.
• The amount of variation in the sample means depends
on the sample variance and the size N.
MECH 430
Slide 30
Sx Sx
N
Standard Deviation of the Means
MECH 430
Slide 31
True Mean Value
• The standard deviation of the means represents a
measure of how well the sample mean represents the
true mean.
• In the absence of systematic errors in a measurement,
the confidence interval states the true value within a
likely range about the sample mean value.
MECH 430
Slide 32
x' x tv,PSx
Example 4.4
• Consider the data in the table below. The mean is
1.02 and the standard variation is 0.16. Estimate the
true mean value of the measurand at 95% probability
based on this finite data set.
MECH 430
Slide 33
Example 4.4
• The probability that the true Mean lies between 0.94
and 1.1 is 95%.
• Or there are a 95% probability that the true mean will
lie between 0.94 and 1.1
(1.02±0.08=1.02±2.93x0.04=1.02±2.93x(0.16/Sqrt(20)
MECH 430
Slide 34
Example 4.4
MECH 430
Slide 35
• Mean x = 1.02
• Standard of the means deviation Sx = 0.04
• Given the probability 95%, find the corresponding
range of mean values, in other words determined xi
• ti = (xi – x)/Sx gives xi = Sx*ti + x
• For this example,
x19,95 = Sx*t19,95 + x
From the Student’s t distribution table, t19,95 = 2.093
thus x19,95 = 0.04*2.093 + 1.02 = 0.08 + 1.02
Interval in which 95% of the means would lie is:1.02 +/- 0.08
MECH 430
Slide 36
Example
• A rotary displacement sensor was tested 16 times and
recorded in degrees as follows:
0.11, 0.12, 0.09, 0.10, 0.10, 0.14, 0.08, 0.08,
0.13, 0.10, 0.10, 0.12, 0.08, 0.09, 0.11, 0.15.
• If we know the standard deviation Sx to be 0.01, what
are the odds that true value should fall within 5% of
the sample mean? (Note: You can assume a normal
distribution and use the appended chart).
MECH 430
Slide 37
Example
• To solve this problem we assume that readings are
normally distributed. The sample mean is computed
as:
• Then we use the following to determine z0 or tvP :
.0 10625
.0 15
.0 11
...
.0 12
.0 11
16
1
X
P X zoSx
N
x' X zoSx
N
p
• Hence
.2 125
100 ( .0 10625)
5
16
( .0 01)
o
o
z
z
MECH 430
Slide 38
Example
• If we use z0:
– interpolate in the z0 table to find the area under the curve to
be 0.4832,
– the desired area is : 0.4832(2)= 0.9664,
– therefore the odds that the mean resolution falls within 5%
of the sample mean is 96.64%.
• If we use t15, P = 2.125:
– interpolate the tv, P Table to get P ≈ 95%
MECH 430
Slide 39
MECH 430
Slide 40
4.6 Regression Analysis
• Regression signifies expressing a group of data points
by a less perfect state.
• In linear regression, that less perfect state is a line.
• Linear regression can be done via an optimization
technique known as least-squares method, which
minimizes the sum of errors between the true y
coordinate of a point and its estimated y coordinate
via the line representing this point (i.e., regression):
2
yi y
2
i1
n
yi b mxi
2
i1
n
x1 y1
x2 y2
xn yn
MECH 430
Slide 41
4.6 Regression Analysis
• To minimize this quantity, take its derivative (with
respect to m and b) and set it to zero:
2
yi y
2
i1
n
yi b mxi
2
i1
n
0
and
0
2
2
b
m
Which results:
m
n
xiyi
i1
n
xi
i1
n
yi
i1
n
n
xi
2
i1
n
xi
i1
n
2
and b
xi
2
i1
n
yi
i1
n
xiyi
i1
n
xi
i1
n
n
xi
2
i1
n
xi
i1
n
2
Example - Calibration
• Given:
– The voltmeter calibration data:
MECH 430
Slide 42
• Plot this data and calibrate.
• Determine the static sensitivity at:
• X = 5.0
• X = 10.0
• X = 20.0
• For which values is the system
more sensitive? Analyze
X [cm]
Y [V]
0.5
0.4
1.0
1.0
2.0
2.3
5.0
6.9
10.0
15.8
20.0
36.4
50.0
110.1
100.0
253.2
Solution
MECH 430
Slide 43
• Using Excel:
X [cm]
Y [V]
0.5
0.4
1.0
1.0
2.0
2.3
5.0
6.9
10.0
15.8
20.0
36.4
50.0
110.1
100.0
253.2
y = 2.5279x - 6.3009
-50
0
50
100
150
200
250
300
0
50
100
150
Voltage [V]
X [cm]
Solution
MECH 430
Slide 44
• Finding the sensitivity at different points:
• X = 5.0, S = 1.8
• X = 10.0, S = 2.1
• X = 20.0, S = 2.5
• As X increases the sensor becomes more sensitive.
Non-linear Calibration Curves
MECH 430
Slide 45
•If the relationship is nonlinear we can set up a look-up
table from the calibration curve.
x
y