
MECH 430 Notes 5, Spring 2014
American University of Beirut · Instrumentation and Measurements · 68 pages




Showing the first 10 of 68 pages. Download the PDF to see all of it.
More MECH 430 files
Show the text of this notes
- +
Instrumentation & Measurements
MECH 430
MECH 430
Slide 1
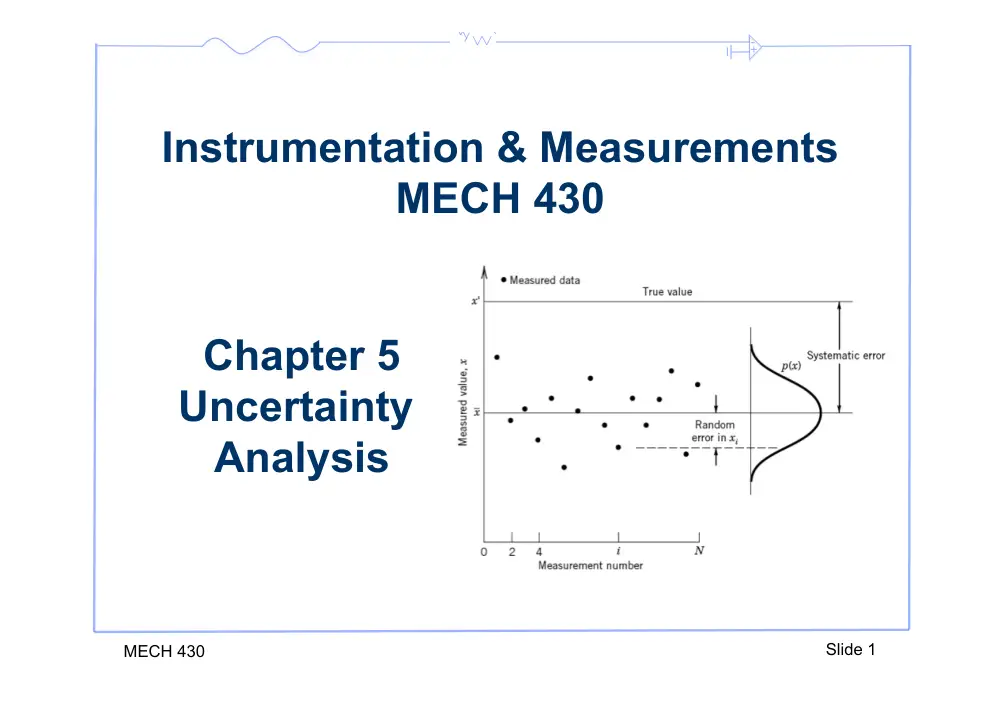
Chapter 5
Uncertainty
Analysis
- +
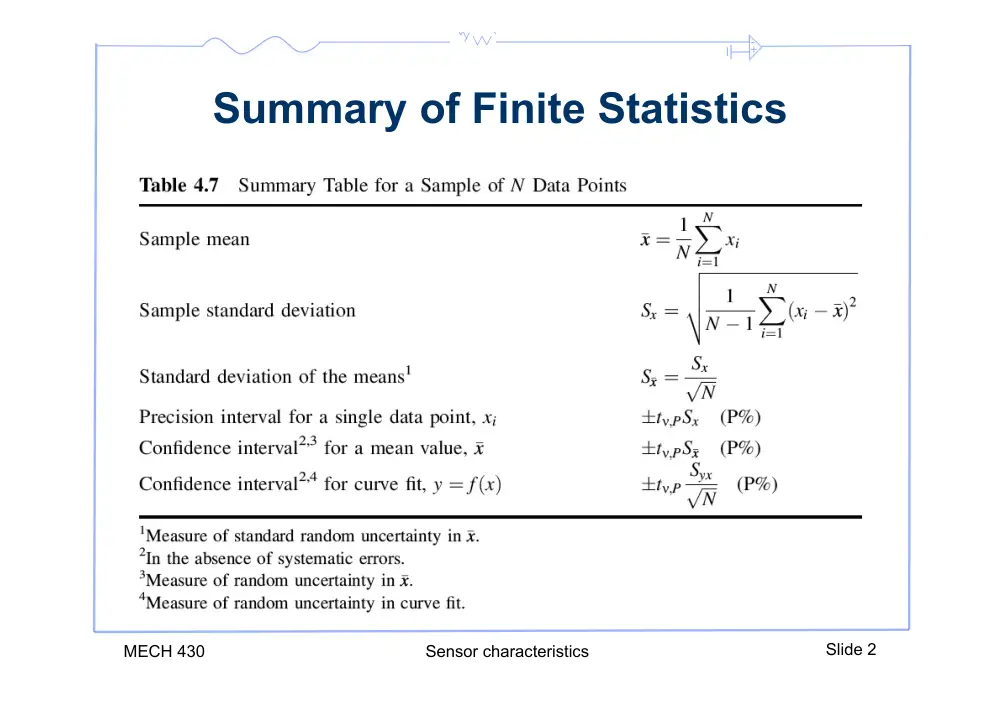
Summary of Finite Statistics
MECH 430
Sensor characteristics
Slide 2
- +
MECH 430
Slide 3
5.1 Introduction
•
Uncertainty analysis provides a methodical approach
to estimating the accuracy of results.
•
In other words we can estimate the “±what” in a
planned test.
•
Errors causes a difference from the true value, but
since we don’t know the true value and hence we
estimate a range of probable error. This estimate is
called uncertainty.
•
Uncertainty is a property of the result.
- +
5.1 Introduction
• The uncertainty describes an interval about the
measured value within which we suspect that the true
value must fall with a stated probability.
• What we want to do is quantify, on average, how
closely the measured value agrees with some known
true value and base our interpretation of subsequent
measured results on that information.
• Uncertainty quantifies the quality of the result.
MECH 430
Sensor characteristics
Slide 4
- +
5.2 Measurement Errors
• An error is the difference between a measured value and
the true value. An error is a property of a measurement.
• Errors are introduced from various elements:
– The instrument,
– The data set finite statistics,
– The approach used.
• Given that we can not know the true value, we can
estimate a range of probable error.
• We call this estimate the uncertainty.
• Uncertainty analysis is the process of identifying,
quantifying, and combining these errors.
MECH 430
Slide 5
- +
MECH 430
Slide 6
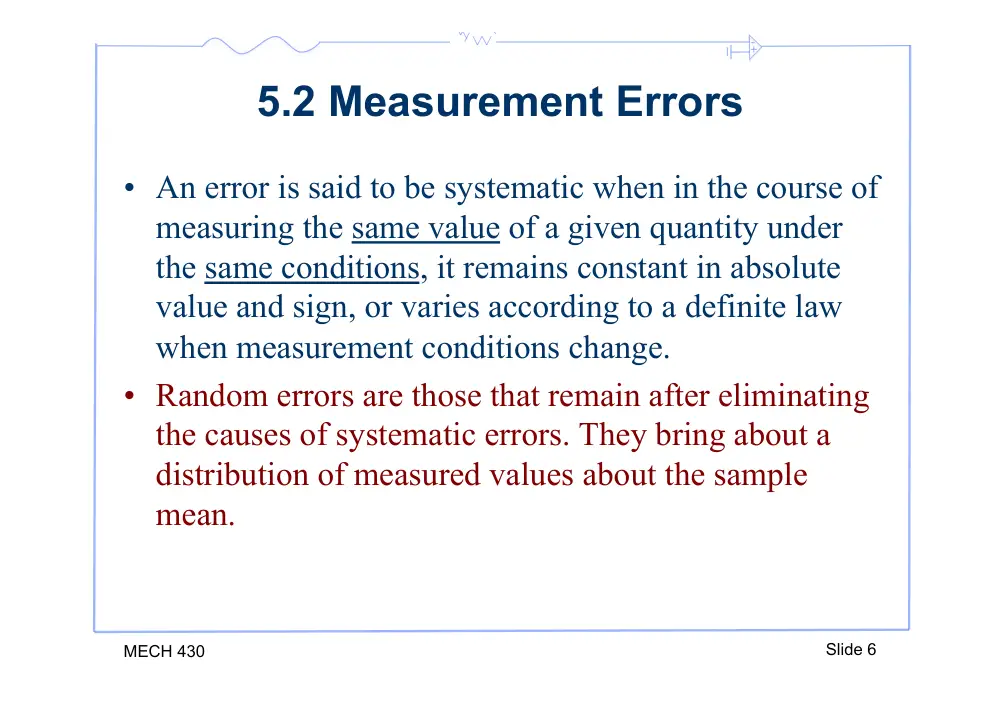
5.2 Measurement Errors
• An error is said to be systematic when in the course of
measuring the same value of a given quantity under
the same conditions, it remains constant in absolute
value and sign, or varies according to a definite law
when measurement conditions change.
• Random errors are those that remain after eliminating
the causes of systematic errors. They bring about a
distribution of measured values about the sample
mean.
- +
Systematic & Random Errors
MECH 430
Slide 7
• The systematic errors
will shift the sample
mean from the true
mean of the measured
variable by a fixed
amount.
• The random errors
bring about a
distribution of
measured values
about the sample
mean.
- +
MECH 430
Slide 8
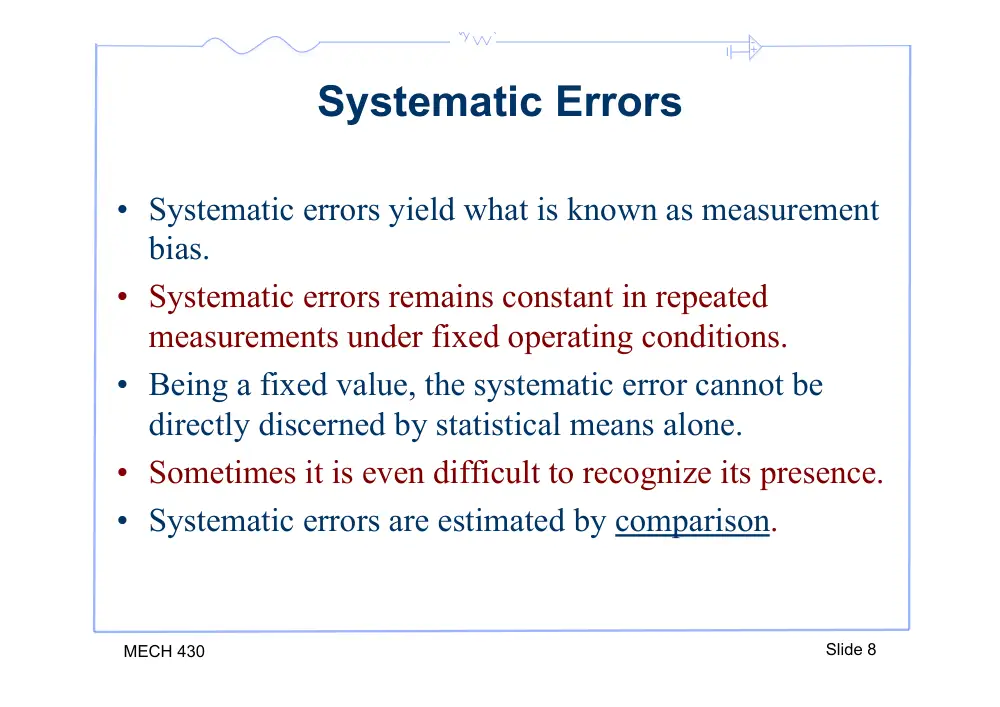
Systematic Errors
• Systematic errors yield what is known as measurement
bias.
• Systematic errors remains constant in repeated
measurements under fixed operating conditions.
• Being a fixed value, the systematic error cannot be
directly discerned by statistical means alone.
• Sometimes it is even difficult to recognize its presence.
• Systematic errors are estimated by comparison.
- +
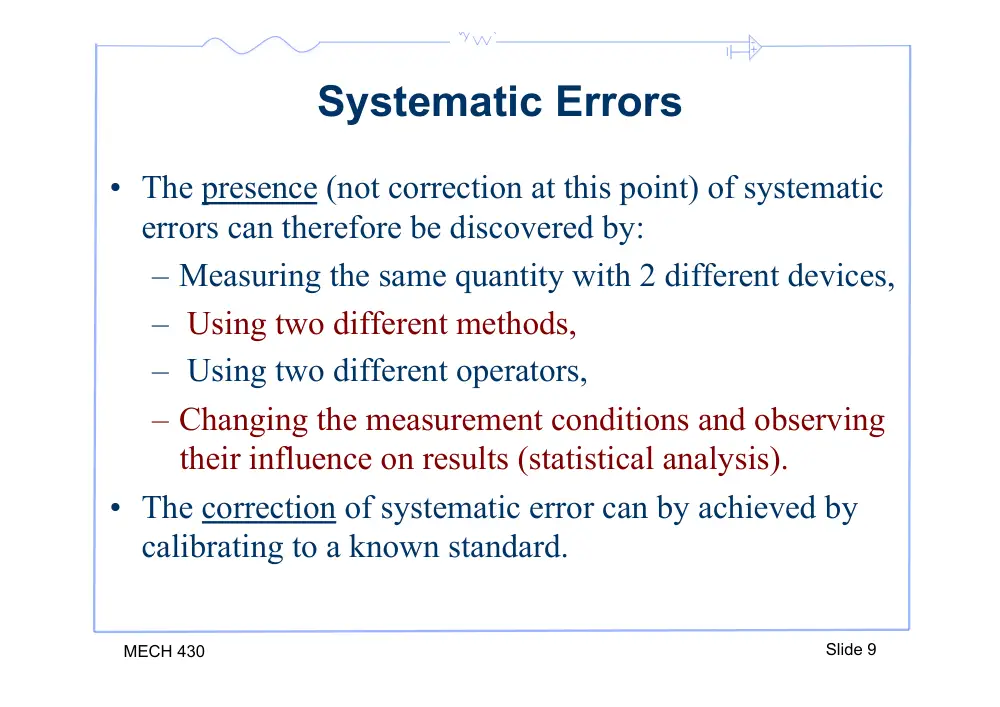
MECH 430
Slide 9
Systematic Errors
• The presence (not correction at this point) of systematic
errors can therefore be discovered by:
– Measuring the same quantity with 2 different devices,
– Using two different methods,
– Using two different operators,
– Changing the measurement conditions and observing
their influence on results (statistical analysis).
• The correction of systematic error can by achieved by
calibrating to a known standard.
- +
Random Errors
• Random error, also called precision error, is affected
by the repeatability and resolution of the
measurement system components.
• Because of the varying nature of the random errors,
exact values cannot be given, but probable estimates
of the error can be made through statistical analyses.
MECH 430
Slide 10
- +
MECH 430
Slide 11
Random Errors
• Random errors are characterized by the following:
– Positive and negative random errors with the same absolute
values have the same occurrence probability.
– The probability of occurrence of a random error decreases as
its absolute value increases.
- +
MECH 430
Slide 12
Random Errors
• In the absence of systematic errors, the best estimate of
the actual value of a measurand is obtained by taking n
measurements and averaging the results:
n
x
x
x
x
n
n
+
+
+
=
2
1
ˆ
• When n is infinite, (1.3) yields the true value for x.
• However, when n is finite, each experiment that yields a
group of x’s gives a different average.
• The random uncertainty at a defined confidence level is
defined by the interval
- +
5.3 Design Stage Uncertainty
• Analysis done prior to measurement.
• It is useful for selecting instruments, measurement
techniques, and estimating the likely uncertainty to
exist in the measured data.
• Data at this level is obtained from catalogues.
• It is probably difficult in this stage to distinguish
between systematic and random errors.
• The goal of the design stage is to estimate the
magnitude of uncertainty in the measured value that
would result from a measurement.
MECH 430
Slide 13
- +
5.3 Design Stage Uncertainty
• The zero-order uncertainty (u0) of an instrument
reflects our ability to resolve the information provided
by the instrument.
• At zero-order uncertainty we assume the variation
expected in the measured values will be that of the
instrument resolution alone and all other aspects of
the measurement are perfectly controlled.
• u0 is an estimate of the expected random uncertainty
caused by the data scatter due to reading the
instrument.
MECH 430
Slide 14
- +
Zero-order Uncertainty
• As a rule of thumb, assign a numerical value to u0 of
one half of the instrument resolution with a
probability of 95%.
MECH 430
Slide 15
u0 = ± 1
2 resolution (95%)
• At 95%, we assume that only one measured value in
20 will have a value outside of u0.
- +
Instrument Uncertainty
• The second piece of information from a manufacturer
is the instrument uncertainty uc
• Essentially, uc is an estimate of the systematic error
for the instrument.
• Sometimes the instrument error will be stated in parts,
each part due to some contributing factor.
• We combine these errors via the root-sum-squares
(RSS) method.
MECH 430
Slide 16
- +
MECH 430
Slide 17
Root Sum Square (RSS) method
• We will refer to each individual error as an elemental
error.
• For example the sensitivity error and the linearity error
of a transducer are two elemental errors.
• Consider a measurement of x subject to k elemental
errors e1,e2,…en:
ux = ± e1
2,e2
2,,eK
2
= ±
ek
2
k=1
K
∑
- +
Different type
of instrument
errors:
- Hysteresis
- Linearity
- Sensitivity
- Zero Shift
- Repeatability
MECH 430
Slide 18
- +
RSS method
• In calculating RSS be careful to be consistent with the
units.
• Furthermore, each error should be estimated at the
same probability level. A general rule is to use 95%.
• If no probability level is provided on the datasheet, a
95% level can be assumed.
MECH 430
Slide 19
- +
5.3 Design Stage Uncertainty
• The design stage uncertainty is then obtained by
combining the instrument uncertainty with the zero-
order uncertainty:
MECH 430
Slide 20
ud =
u0
2 + uc
2
• The design stage uncertainty is used as a guide for
selecting equipment and is NOT the final estimate of
the total uncertainty in a measurement system.
• If additional information is known at this stage then
should be included in the above equation.
- +
5.3 Design Stage Uncertainty
MECH 430
Sensor characteristics
Slide 21
- +
Example 5.1
• Given: a force measuring instrument is described by
the catalogue data below.
• Estimate: the uncertainties attributable to this
instrument and the instrument design stage
uncertainty.
MECH 430
Slide 22
Resolution
0.25N
Range
0 to 100N
Linearity
within 0.2 N over range
Hysteresis
within 0.3N over range
- +
Example 5.1
• Solution: first find elemental errors of linearity and
hysteresis
MECH 430
Slide 23
ulinearity = 0.2N
uhysteresis = 0.3N
• Next combine using RSS to find uc:
uc = ± 0.22 + 0.32 = ±0.36N (95%)
• The instrument resolution is 0.25N so u0 = ±0.125N
• Finally the design-stage uncertainty is:
ud = ± u0
2 + uc
2 = ± 0.362 + 0.1252 = ±0.38N (95%)
- +
Example 5.2
• Given: a voltmeter is to be used to measure the output
of a pressure transducer.
• Pressure transducer (3psi expected nominal pressure)
– Range: ±5psi
– Sensitivity: 1V/psi
– Input power: 10VDC ±1%
– Output: ±5V
– Linearity: within 2.5mV/psi over range
– Sensitivity: within 2mV/psi over range
– Resolution: negligible
MECH 430
Slide 24
- +
Example 5.2
• Voltmeter
– Resolution: 10µV
– Accuracy: within 0.001% reading
• Find:
– uc for each device
– ud for the measurement
MECH 430
Slide 25
- +
Example 5.2
• Solution:
MECH 430
Slide 26
The design stage uncertainty for the voltmeter is:
(ud
)E = ±
(u0
)E
2 + uc
(
)E
2 = ±30.4µV (95%)
(u0
)E = ±5µV (95%)
(uc
)E = ± 3V × 0.00001
(
) = ±30µV (95%)
- +
Example 5.2
• Solution:
MECH 430
Slide 27
The design stage uncertainty for the pressure transducer is:
(ud
)E = ±
(u0
)E
2 + uc
(
)E
2 = ±9.61mV (95%)
(u0
)P = 0
(uc
)P = ±
(2.5mV / psi × 3psi
)
2 + 2mV / psi × 3psi
(
)
2 = ±9.61mV (95%)
- +
Example 5.2
• Solution:
MECH 430
Slide 28
Finally, the design stage uncertainty for the entire
system is:
ud = ±
(ud
)E
2 + ud
(
)P
2 = ±
(0.030mV
)
2 + 9.61mV
(
)
2 = ±9.61mV (95%)
Using the sensitivity of 1V/psi, the uncertainty in psi is:
ud = ±0.0096psi (95%)
- +
5.4 Error Sources
• Design-stage uncertainty does not address all possible
errors.
• If we consider the measurement process to consist of 3
steps, and each has an uncertainty associated with it:
– calibration error,
– data-acquisition error,
– data reduction error.
MECH 430
Slide 29
- +
5.4 Error Sources
MECH 430
Slide 30
Calibration errors
DAQ errors
Data reduction errors
- +
5.6 Error Propagation
• Very often results are obtained through a functional
relationship with measured values.
• For example the measurement of flow rate using time
and volume. Q = f( t, V)
• How do uncertainties in either quantity contribute to
uncertainty in flow rate?
• Is the uncertainty in Q more sensitive to uncertainty
in t or v?
• How are errors propagated to a calculated result?
MECH 430
Slide 31
- +
5.6 Error Propagation
• The true value of y falls within the interval
MECH 430
Slide 32
y ± δy = f (x ± tSx )
- +
5.6 Error Propagation
• Expanding using a Taylor series:
MECH 430
Slide 33
y ± δy = f (x ± tSx )
y ± δy = f (x) ±
dy
dx
"
#$
%
&'
x= x
tSx + 1
2
d 2y
dx2
"
#$
%
&'
x= x
(tSx
)
2 +
(
)
*
*
+
,
-
-
• If is small and if we neglect higher order terms:
tSx
δy ≈
dy
dx
#
$%
&
'(
x= x
tSx
- +
5.6 Error Propagation
• From above the uncertainty for the dependent variable
is related to the uncertainty in the independent
variable by:
MECH 430
Slide 34
uy =
dy
dx
!
"#
$
%&
x= x
ux
- +
Multiple Variables
• For multiple variables with R = f1(x1, x2, …, xL) the
best estimate for the true mean R’ is:
MECH 430
Slide 35
R' = R ± uR (P%)
R = f1(x1,x2,,xL)
uR = ±
(θiuxi
)
2
i=1
L
∑
#
$%
&
'(
1/2
(P%)
θi = ∂R
∂xix=x
i = 1,2,...,L
- +
Example 5.3
• Given:
– A displacement sensor has a calibration curve y = KE,
– E = 5V,
– K = 10.10 mm/V
– uK = ±0.10 mm/V (95% confidence)
– uE = ±0.01 V (95% confidence)
• Find:
– The uncertainty in displacement
MECH 430
Slide 36
- +
Example 5.3
• Solution
MECH 430
Slide 37
y = f (E,K)
uy = f (uE,uK )
• The uncertainty is found as:
uy = ±
(θEuE
)
2 + θKuK
(
)
2
"#
$%
1/2
θE = ∂y
∂E = K
θK = ∂y
∂K = E
• Therefore:
uy = ±
(K(0.01)
)
2 + E(0.1)
(
)
2
!"
#$
1/2
= ±0.51mm (95%)
- +
Sequential Perturbation
• It might be difficult to find the partial derivatives in
the previous method.
• We then resort to something known as sequential
perturbation.
• This method is based on using a finite difference
method to approximate the derivatives.
MECH 430
Slide 38
- +
Sequential Perturbation
• Start by finding an operating point Ro= f(x1, x2,…, xL)
• Next, increase the independent variables by their
uncertainties to find
MECH 430
Slide 39
Ri
+
R1
+ = f (x1 + ux1,x2,...,xL),
R2
+ = f (x1,x2 + ux2 ,...,xL),...
RL
+ = f (x1,x2,...,xL + uxL )
• Do the same to find
• Calculate the differences:
Ri
−
δRi
+ = Ri
+ − Ro
δRi
− = Ri
− − Ro
- +
Sequential Perturbation
• Finally find the approximate uncertainty contribution
of each variable.
MECH 430
Slide 40
• The uncertainty is then calculated as:
uR = ±
(δRi
)
2
i=1
L
∑
#
$%
&
'(
1/2
(P%)
δRi = δRi
+ − δRi
−
2
≈ θiui
- +
Example 5.3 (continued)
• Alternatively we can use sequential perturbation with
Ro = 50.5 mm
MECH 430
Slide 41
• The uncertainty is found as:
uy = ±
(0.10
)
2 + 0.5
(
)
2
!"
#$
1/2
= ±0.51mm
• Therefore the displacement is:
y' = 50.50 ± 0.51mm (95%)
i
xi
1
E
50.60
50.40
0.1
-0.1
0.1
2
K
51.00
50.00
0.5
-0.5
0.5
Ri
+
Ri
−
δRi
+
δRi
−
δRi
- +
MECH 430
Slide 42
Principle of equal effects
•
If you have the total uncertainty and want to find each
individual uncertainty, we can use the principal of
equal effects.
•
This principal states that each source of uncertainty
∆ui contributes an equal amount to the total
uncertainty ∆R.
(
)
i
i
u
R
n
R
u
∂
∂
Δ
=
Δ
/
(1)
- +
MECH 430
Slide 43
Example
• A dynamometer is used to measure
the average power output on a shaft.
t
RFL
P
12
550
2
×
=
π
Time of run (s)
Number of revolutions of
the shaft during t seconds
Force at the end of
the torque arm (lbf)
Length of
torque arm (ft)
Average power (hp)
K
- +
MECH 430
Slide 44
Example
• Given:
– For a given run we have the following measurements
with their associated errors
– Find the overall uncertainty:
.0 55 s
.00
60
.0 05 in
.63
15
.0 04 lbf
.12
10
1rev
1202
±
=
±
=
±
=
±
=
t
L
F
R
- +
MECH 430
Slide 45
Example
•
Solution:
–
Find the partial differentials:
051 hp/s
.0
193 hp/in
.0
0251 hp/rev
.0
298 hp/lbf
.0
2
= −
∂ =
∂
=
=
∂
∂
=
=
∂
∂
=
=
∂
∂
t
KFLR
t
P
t
KFR
L
P
t
KFL
R
P
t
KLR
F
P
F = 10.12 ± 0.04 lbf
R = 1202 ±1 rev
L = 15.63 ± 0.05 in
t = 60.00 ± 0.55 s
- +
MECH 430
Slide 46
Example
•
The overall uncertainty is found as:
ΔRRSS =
(0.04 × 0.298
)
2 + 1× 0.00251
(
)
2 + 0.05 × 0.193
(
)
2 + 0.55 × 0.05
(
)
2
= .0 029 hp
Δ
RSS
R
•
The power is calculated as:
= .3 016 hp
=
t
KFLR
P
• If we wish to measure P to within 0.5% uncertainty,
what are the errors associated with each individual
measurement?
- +
MECH 430
Slide 47
Example
ΔF =
ΔP
n ∂P / ∂F
(
)
= 0.005 × 3.016
4 0.298
(
)
= 0.013 lbf
ΔR =
ΔP
n ∂P / ∂R
(
)
= 0.005 × 3.016
4 0.00251
(
)
= 1.5 rev
ΔL =
ΔP
n ∂P / ∂F
(
)
= 0.005 × 3.016
4 0.193
(
)
= 0.019 in
Δt =
ΔP
n ∂P / ∂F
(
)
= 0.005 × 3.016
4 0.05
(
)
= 0.075 s
• Using the principle of equal effects:
- +
5.7 Advanced Stage Uncertainty
• Higher order uncertainty considers the
controllability of test operating
conditions and the variability of all
measured variables.
• For example, at a first order level, the
effect of time as an extraneous variable
could be considered.
MECH 430
Slide 48
uN =
uc
2 + (
ui
2
i=1
N −1
∑
)
#
$
%
%
&
'
(
(
1/2
(P%)
u0 = ± 1
2 resolution
u1 = ±t J −1
(
),95ST
- +
Example 5-4
• Examine a dial oven thermometer and assess the zero
and first order uncertainties if we have J
measurements
MECH 430
Slide 49
u0 = ± 1
2 resolution
u1 = ±t J −1
(
),95ST
- +
Example
• A stopwatch is to be used to estimate the time
between the start and end of an event. Event duration
might range from several seconds to 10 minutes.
Estimate the probable uncertainty in a time estimate
using a stopwatch that claims an accuracy of 1 minute
per month and a resolution of 0.01 seconds.
MECH 430
Sensor characteristics
Slide 50
- +
Example
• Zero stage uncertainty
MECH 430
Sensor characteristics
Slide 51
u0 = ±0.01/ 2s
uc = ±
60s
1(30)(24)(60)(60)s T
T =10s
⇒ ud = ± u0
2 +uc
2 = ± 0.0052 + 10
60
1(30)(24)(60)(60)
"
#$
%
&'
2
= ±0.005s
T =10min = 600s
⇒ ud = ± u0
2 +uc
2 = ± 0.0052 + 10(600)
60
1(30)(24)(60)(60)
"
#$
%
&'
2
= ±0.015s
- +
Example
• Now assume that the operator takes some time to detect the
start and end of the event. Assume this uncertainty is quantified
as 150ms with 95% probability.
MECH 430
Sensor characteristics
Slide 52
u0 = ±0.01/ 2s
uc = ±
60s
1(30)(24)(60)(60)s T
u1 = ±0.150s
t =10s
⇒ uN = ± u1
2 +uc
2 = ± 0.152 + 10
60
1(30)(24)(60)(60)
"
#$
%
&'
2
= ±0.15s
t =10min = 600s
⇒ uN = ± u1
2 +uc
2 = ± 0.152 + 10(600)
60
1(30)(24)(60)(60)
"
#$
%
&'
2
= ±0.151s
- +
Example
• First stage uncertainty is more important (bigger) than the
instrument uncertainty. For what duration is this true?
MECH 430
Sensor characteristics
Slide 53
uc = ±
60s
1(30)(24)(60)(60)s T
u1 = ±0.150s
T = ???
⇒ uN = ± u1
2 +uc
2 = ± 0.152 + T
60
1(30)(24)(60)(60)
"
#$
%
&'
2
T
60
1(30)(24)(60)(60) > 0.15 ⇒ t >1.8hrs
- +
5.8 Multiple Measurement Uncertainty
• This is applicable if we are able to obtain multiple
measurement for each variable of our experiment.
• The propagation of random uncertainty:
MECH 430
Slide 54
P = (P1
2 + P2
2 +PK
2)1/2
• The propagation of elemental systematic error is:
standard random
uncertainty of each
measurement
B = (B1
2 + B2
2 +BK
2 )1/2
systematic uncertainty
of each measurement
- +
5.8 Multiple Measurement Uncertainty
• The total uncertainty is then:
MECH 430
Slide 55
ux = ± B2 + tv,95P
(
)
2
(
)
1/2
(95%)
v =
Pk
2
k=1
K
∑
"
#$
%
&'
2
Pk
( 4 / vk
)
k=1
K
∑
• v is found via the Welch-Satterthwaite formula:
- +
5.8 Multiple Measurement Uncertainty
MECH 430
Sensor characteristics
Slide 56
- +
Example 5.12
• Measuring stress in a loaded beam we observe three
sources of uncertainty as follows:
MECH 430
Slide 57
• If the mean value of stress is 223.4N/cm2
• Determine the best estimate of stress at 95% confidence
B1 = 1.0N/cm2
B2 = 2.1N/cm2
B3 = 0 N/cm2
P1 = 4.6N/cm2
P2 = 10.3N/cm2 P3 = 1.2N/cm2
v1 = 14
v2 = 37
v3 = 8
- +
Example 5.12
• The random uncertainty is:
MECH 430
Slide 58
P = (P1
2 + P2
2 +PK
2)1/2 = 11.3N / cm2
• The systematic uncertainty is:
B = (B1
2 + B2
2 +BK
2 )1/2 = 2.3N / cm2
• The degree of freedom is:
v =
Pk
2
k=1
3
∑
"
#$
%
&'
2
Pk
( 4 / vk
)
k=1
3
∑
≈ 49
- +
Example 5.12
• t49,95 = 2 and the uncertainty estimate is:
MECH 430
Slide 59
• The best estimate of a result is:
uσ = ±[B2 + tv,95P
(
)
2]1/2 = ±[2.32 + 2 ×11.3
(
)
2]1/2 = ±22.7N / cm2
σ ' = 223.4 ± 22.7N / cm2 (95%)
- +
Propagation of Uncertainty
• If we have a function f(x1, x2,…,xn), the true value can
be expressed as:
MECH 430
Slide 60
R' = R ± uR (P%)
R = f1 x1,x2,xL
(
)
uR = ± BR
2 + tv,95PR
(
)
2
(
)
1/2
(95%)
BR =
"#θiBxi
$%
2
i=1
L
∑
'
()
*
+,
1/2
PR =
"#θiPxi
$%
2
i=1
L
∑
'
()
*
+,
1/2
v =
θiPxi
2
k=1
K
∑
#
$%
&
'(
2
(θiPxi
)
4 / vxi
(
)
k=1
K
∑