
CSC 316 Chapter 2d, Spring 2004
Notre Dame University–Louaize · Computers Security and Their Data · 99 pages · Dr. Victor Sawma




Showing the first 10 of 99 pages. Download the PDF to see all of it.
More CSC 316 files
Show the text of this chapter
Aggregate Expenditure and
Equilibrium Output
Consumption
1
Consumption
What Determines the Level
of Consumption?
2
The Role of Income
Disposable Income: The current income you
receive in your paycheck, after you pay taxes.
Expected Future Income: The income you
expect to receive in the future
3
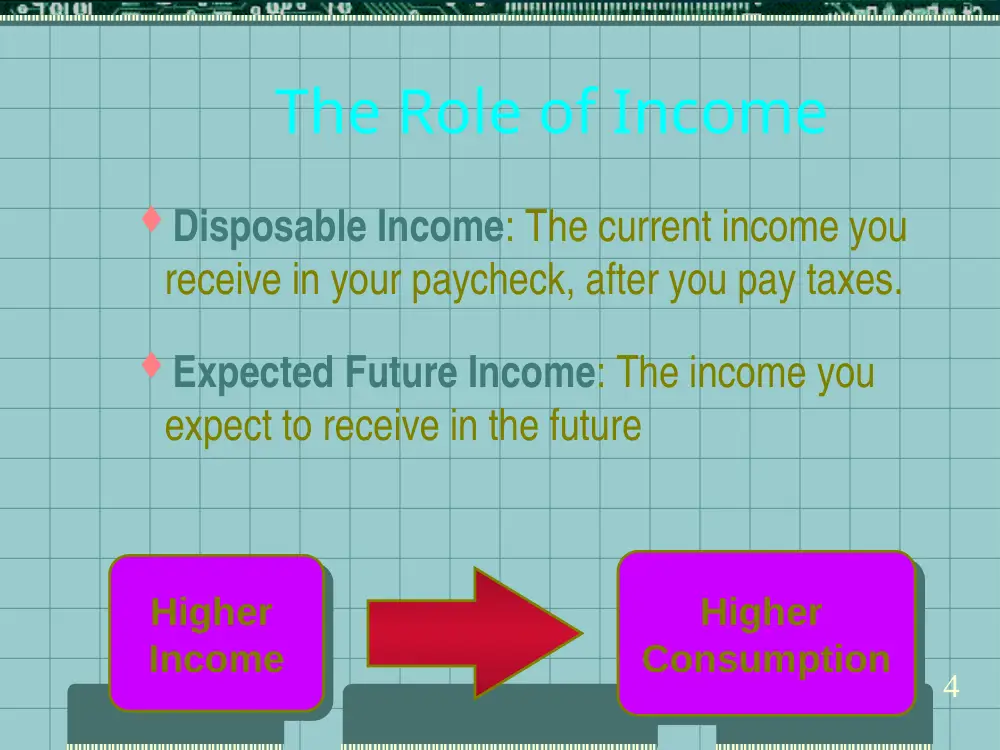
The Role of Income
Disposable Income: The current income you
receive in your paycheck, after you pay taxes.
Expected Future Income: The income you
expect to receive in the future
Higher
Income
Higher
Income
Higher
Consumption
Higher
Consumption
4
Income = Consumption + Savings + Taxes
Y = C + S + T
Income
Consumption
Savings
Taxes
5
Consumption Schedule
Income
0
1000
2000
3000
4000
Consumption
500
1250
2000
2750
3500
Assuming Taxes=0
6
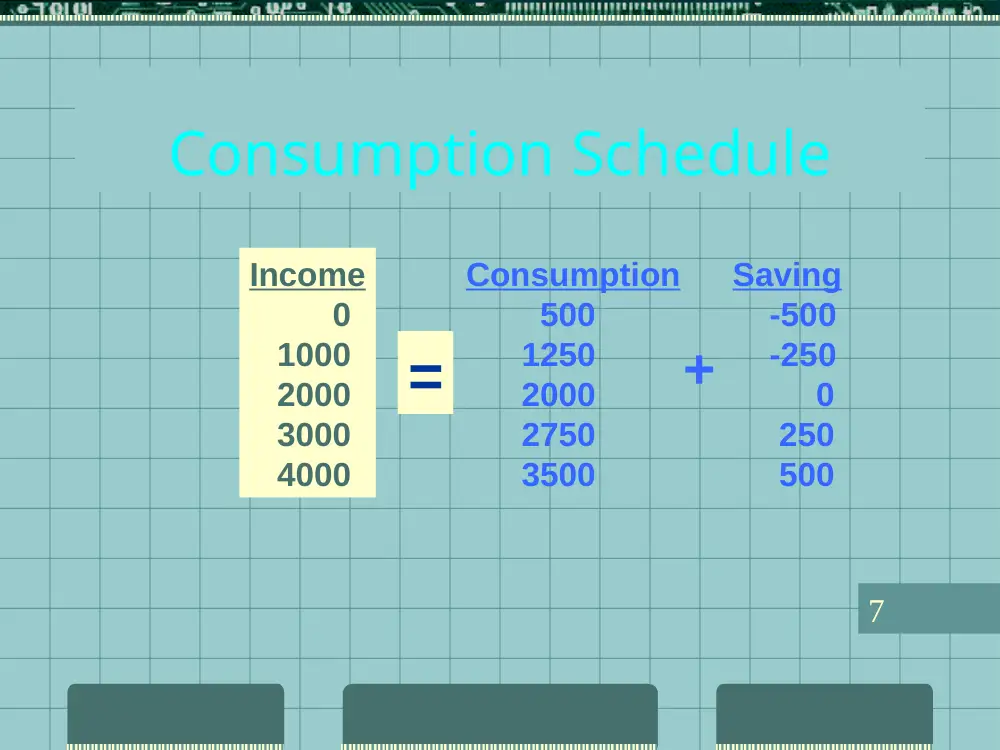
Consumption Schedule
Income
0
1000
2000
3000
4000
Consumption
500
1250
2000
2750
3500
Saving
-500
-250
0
250
500
=
+
7
T
F
Consumption plus disposable
income is equal to savings.
8
The statement is “FALSE”
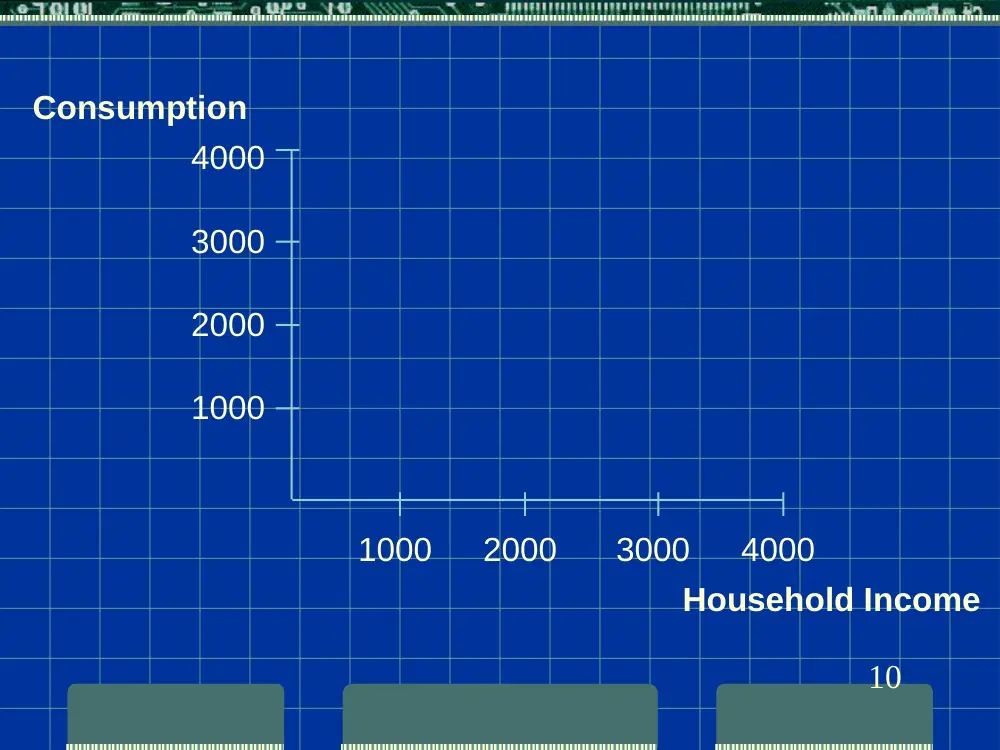
Consumption
4000
3000
2000
1000
9
Household Income
Consumption
4000
3000
2000
1000
4000
2000
1000
3000
10
Household Income
Consumption
4000
3000
2000
1000
4000
2000
1000
3000
45
o line
11
0
1000
2000
3000
4000
5000
0
1000
2000
3000
4000
Household Income
Consumption
45o
Con-
sumption
12
0
1000
2000
3000
4000
5000
0
1000
2000
3000
4000
Consumption
45o
C
C
Y
Slope =
C
Y
Household Income
13
0
1000
2000
3000
4000
5000
0
1000
2000 3000 4000
Consumption
45o
C
C=750
Y=1000
Slope = 0.75
Household Income
14
5000
5000
C = 500 + .75*Income
People buy goods even when their income is
zero
75% of each dollar of income is consumed
25% of each dollar is saved
0.75 is the Marginal Propensity to Consume
(MPC)
15
What is the marginal propensity to consume,
MPC, in the figure?
a.
1.00
b.
0.90
c.
0.67
d.
$3 million
Disposable income
(millions of dollars)
0 1 2 3 4 5
4 -
3 -
2 -
1 -
' ' ' ' '
Consumption
Consumption
expenditure (millions of
dollars)
16
The correct
answer
is
“c”
Savings
Savings = Income - Consumption
MPS: marginal propensity to save
MPS = 1 - MPC
C = Ca + MPC ( Y )
S = Y - C = Y - Ca - MPC ( Y )
= - Ca + Y ( 1 - MPC )
= Sa + MPS ( Y )
17
EXAM TYPE QUESTION
Consumption expenditure increases when ………………
increases.
a.
the interest rate
b.
the price level
c.
real GDP
d.
saving
The correct answer is
“c”
18
Given the following schedule:
__DI__
__C__
100
110
200
120
300
130
400
140
500
150
Formulate the saving function, by setting numerical values
where possible.
__S__
-10
80
170
260
350
80= Sa + 90/100 ( 200 )
Sa = 80 - 0.9 ( 200 ) = -100
S = -100 + 0.9 ( DI )
19
T
F
The part of each dollar
which is not consumed is
not necessarily saved.
FALSE
20
Given the following schedule,
DI
S
200
10
300
20
400
30
500
40
600
50
Formulate the consumption function, by setting
numerical values where possible.
190 = Ca + 0.9 ( 200 )
Ca = 190 - 180 = 10
C = 10 + 0.9 ( DI )
21
23
30
20
10
0
-10
-20
100
200
300
400
500
Saving
Saving
Disposable
Personal
Income
The higher the level of income,
a.
The smaller the APS
b.
The greater the APS
c.
The smaller the MPS
d.
The greater the MPS
e.
None of the above
The correct answer is
“b”
23
As income rises, what happens to
a.
The amount consumed?
24
C
Y
Exp.
Rises
b.
The amount saved?
S
Y
S
Rises
As income rises, what happens to
c.
Proportion of consumption to income?
Assume an MPC of 0.9. Assume when income was 800,
consumption was 750.
APC = 750 ÷ 800 = 0.9375
If income rises by 200, up to 1,000, consumption shall rise
by 0.9 x 200 = 180, up to 930.
APC’ = 930 ÷ 1,000 = 0.93 < 0.9375
So the proportion of consumption to income falls.
d.Proportion of savings to income?
MPS = 1 - 0.9 = 0.1
When income was 800, saving was 50.
APS = 50 ÷ 800 = 0.0625
If income rises by 200, up to 1,000, saving shall rise by
0.1 x 200 = 20, up to 70.
APS’ = 70 ÷ 1,000 = 0.07 > 0.0625
So the proportion of savings to income rises.
If people save a higher proportion of their
income than they consume, what type of a
relationship can be derived in terms of
propensities?
APS > APC
26
Consumption
45o
Consumption
Function
Y
C
S
Household Income
27
Exp.
Y = DI
Y = DI
0
0
500
-500
S
S
45º line
C
BE
2000
Y2
Y1
YBE
a
b
c
b'
a'
c’
SAVING
DISSAVING
Y1
C1
Y2
C2
CBE
YBE
28
The saving function
a. Shows what households plan to save at various income
levels.
b. Slopes upward to the right because saving increases as
income increases.
c. Has a slope equal to the MPS
d. Can be derived from the consumption function.
e. Is characterized by all of the above.
The correct answer is
29
“e”
a.
Show on the diagram, the area of
positive savings.
Positive
savings
b. Are the very poor able to save? Why?
Show a possible income level for the
poor on the diagram, and the level of
savings thereon.
The very poor are not able to save.
Because their income is low, almost enough for them to survive.
A possible income level for the poor.
Y
The level of
dissavings at Y.
30
BREAK-EVEN
BREAK-EVEN
BREAK-EVEN IS WHEN Y = C
DIFFERENTLY SPEAKING, WHEN S = 0
YBE = C = Ca + MPC ( Y BE )
YBE - MPC ( YBE ) = Ca
YBE ( 1 - MPC ) = Ca
YBE = ___Ca__ = _Ca_
1 - MPC
MPS
IN OUR EXAMPLE: YBE = 500 = 2,000
0.25
31
Our assumptions concerning consumption and saving
include all of the following except:
a.
The MPS and MPC are both positive and less than
one
b.
The APC falls as income rises
c.
The APS rises as income rises
d.
The MPC is negative below the break-even level of
income
The correct answer is
“d”
Increase in MPC
An increase in the MPC increases the slope of
the consumption function…
33
Consumption
45o
Consumption
Function
Increase in MPC
Household Income
34
Increase in the Constant
An increase in the constant shifts the entire
consumption function upward, parallel to the
original.
A shift in the consumption function will take
place due to a change in one of the
exogenous variables of consumption.
35
Consumption
45o
Consumption
Function
Increase in Constant
Household Income
36
EXOGENOUS VARIABLES OF
CONSUMPTION
EXOGENOUS VARIABLES OF
CONSUMPTION
STOCKS OF LIQUID ASSETS
STOCKS OF DURABLE GOODS ON HAND
EXPECTATIONS
CONSUMER INDEBTEDNESS
ATTITUDES TOWARD THRIFT
TAXATION
37
STOCKS OF LIQUID ASSETS
STOCKS OF LIQUID ASSETS
LIQUID ASSETS ARE LIKE CASH AND SECURITIES
AS THE STOCKS OF LIQUID ASSETS WITH
PEOPLE RISE THROUGHOUT TIME
CONSUMERS FEEL MORE SECURE FINANCIALLY
THEY CONSUME MORE AND SAVE LESS
CONSUMPTION RISES
INCOME HELD CONSTANT, SAVING FALLS
38
Exp.
Y = DI
Y = DI
0
0
S
S
45º line
C
BE
YBE
C’
S’
BE’
YBE’
WE RECOGNIZE
THAT AS
CONSUMPTION
RISES, AND
SAVING FALLS,
‘‘B.E.’’ CHANGES
BUT THE
PARALLELITY
OF ‘‘YBE’’ ON
THE TWO
DIAGRAMS
STAYS
39
STOCKS OF DURABLE
GOODS ON HAND
STOCKS OF DURABLE
GOODS ON HAND
DURABLE GOODS ARE THOSE GOODS THAT
ARE USEFUL FOR LONGER THAN A YEAR
AS THE STOCKS OF DURABLE GOODS RISE
THE NEED TO BUY ADDITIONAL DURABLE
GOODS FALLS
CONSUMPTION FALLS, AND SAVING RISES
40
EXPECTATIONS
EXPECTATIONS
PRICES
PRICES: AS PEOPLE EXPECT PRICES TO
: AS PEOPLE EXPECT PRICES TO
RISE IN THE FUTURE,
RISE IN THE FUTURE,
THEY PLAN TO BUY MORE NOW, BEFORE
THEY PLAN TO BUY MORE NOW, BEFORE
PRICES HAVE RISEN,
PRICES HAVE RISEN,
STORE THE EXCESSIVE GOODS PURCHASED,
STORE THE EXCESSIVE GOODS PURCHASED,
AND USE THEM IN THE FUTURE,
AND USE THEM IN THE FUTURE,
BY THIS THEY AVOID PAYING THE
BY THIS THEY AVOID PAYING THE
EXPECTED FUTURE HIGH PRICES.
EXPECTED FUTURE HIGH PRICES.
CONSUMPTION RISES, SAVING FALLS
CONSUMPTION RISES, SAVING FALLS
41
SHORTAGES: AS PEOPLE EXPECT
POSSIBLE SHORTAGES IN THE FUTURE,
THEY PLAN TO BUY MORE NOW,
STORE THE EXCESSIVE GOODS,
AND USE THEM IN THE FUTURE,
TO AVOID THE PROBLEM OF SHORTAGES
CONSUMPTION RISES, SAVING FALLS
42
INCOMES: AS PEOPLE EXPECT THEIR
INCOMES TO RISE IN THE FUTURE,
THEY FEEL SAFER ABOUT THE FUTURE,
THEIR NEED FOR SAVING LOSES GROUND,
THEY SAVE LESS, SO THEY CONSUME MORE
CONSUMPTION RISES, SAVING FALLS
43
If people expect incomes to fall in the future, what shall be the impact of
such an expectation upon consumption and savings? Demonstrate
graphically.
c
s
c’
s’
44
CONSUMER INDEBTEDNESS
CONSUMER INDEBTEDNESS
AS PEOPLE FIND OUT THAT THEIR
INDEBTEDNESS HAS INCREASED
THROUGHOUT TIME,
THEY PLAN TO SAVE MORE,
TO BE ABLE TO SETTLE THEIR DEBTS,
SAVING RISES, SO CONSUMPTION FALLS
45
ATTITUDES TOWARD
THRIFT
ATTITUDES TOWARD
THRIFT
AS A SOCIETY BECOMES MORE THRIFTY,
PEOPLE PLAN TO SAVE MORE, SO TO
CONSUME LESS,
CONSUMTPION FALLS, SAVING RISES
46
TAXATION
TAXATION
DI = Y - T
AS TAXATION RISES,
DI FALLS
DI = C + S
AS DI FALLS,
CONSUMPTION FALLS AND SAVING FALLS
47
Exp.
Y = DI
Y = DI
0
0
S
S
45º line
C
BE
YBE
C’
S’
BE’
YBE’
WE RECOGNIZE
THAT THE
PARALLELITY OF
“YBE” ON THE
TWO DIAGRAMS
HAS BEEN
VIOLATED.
48
YBE’
A reduction in personal income taxes is likely
to cause which of the following changes in
the components of total spending?
a.
Increased consumption
b.
Increased investment
c.
Decreased government expenditures
d.
Increased exports
e.
Decreased imports
The correct answer is
49
“a”
Exp.
Y
C
C C’
SHIFT
Demonstrate
graphically the
difference between
a shift in
consumption and a
change in the level
of consumption.
50
CHANGE IN
THE LEVEL
Exp.
Y
Which of the following would cause the
saving function to shift downward?
a.
A downward shift in the consumption
function
b.
An increase in the interest rate
c.
An increase in the MPS
d.
A decrease in the MPS
e.
An increase in personal income taxes
The correct answer is
“e”
51
Aggregate Expenditure and
Equilibrium Output
Investment
52
Investment
53
What Determines the Level of
Planned Investment?
Real interest rates
Expected future profits, That is, the expected
rate of return.
54
EXAMPLE
EXAMPLE
Assume a one year investment project costs
$10,000
The expected return is $12,000
Then, the net return would be $2,000
The expected rate of return would be 20%
If the real interest rate is less than 20%, the
investment project will be taken
55
What Determines the Level
of Planned Investment?
Real interest rates
Expected future profits
Lower Interest Rates
Lower Interest Rates
Higher Expected
Future Profits
More
Investment
(I)
56
THE INVESTMENT
DEMAND
THE INVESTMENT
DEMAND
_In_
ERR
0
50%
5
45%
10
40%
15
35%
20
30%
25
25%
__i__
50%
45%
40%
35%
30%
25%
57
THE INVESTMENT
DEMAND CURVE
THE INVESTMENT
DEMAND CURVE
i
0
In
50%
i1
i2
In1
In2
50
ID
MONEY MARKET
i
$
SM
DM
0
i1
SM’
DM’
E
E’
i2
a
b
58
Which of the following is required to determine the
investment function?
a.
The saving function
b.
The interest rate
c.
The consumption function
d.
The investment demand curve
e.
b and d
The correct answer is
“e”
59