
ACCT 215 Problems Solutions, Fall 2011
American University of Beirut · Management Accounting · 26 pages · with solution


Showing the first 10 of 26 pages. Download the PDF to see all of it.
More ACCT 215 files
- Problems Solutions · Fall 2011Problems · with solutionView
- Problems Solutions · Fall 2011Problems · with solutionView
- Problems Solutions · Fall 2011Problems · with solutionView
- Problems Solutions · Fall 2011Problems · with solutionView
- Problems Solutions · Fall 2011Problems · with solutionView
- Problems Solutions · Fall 2011Problems · with solutionView
- Problems Solutions · Fall 2011Problems · with solutionView
- Problems Solutions · Fall 2011Problems · with solutionView
Show the text of this problems
Chapter 5 Cost-Volume-Profit Relationships
Chapter 5
Cost-Volume-Profit Relationships
Exercise 5-9 (20 minutes)
1. The company’s degree of operating leverage would be computed as
follows:
Contribution margin.............. $36,000
÷ Net operating income........ $12,000
Degree of operating
leverage................................
3.0
2. A 10% increase in sales should result in a 30% increase in net
operating income, computed as follows:
Degree of operating leverage....................................
3.0
× Percent increase in sales..........................................
10
%
Estimated percent increase in net operating
income........................................................................
30
%
3. The new income statement reflecting the change in sales is:
Amount
Percent
of Sales
Sales............................... $132,000
100%
Variable expenses........
92,400
70
%
Contribution margin....
39,600
30
%
Fixed expenses.............
24,000
Net operating income..
$ 15,600
Net operating income reflecting change in sales.. $15,600
Original net operating income (a)...........................
12,000
Change in net operating income (b)........................
$ 3,600
Percent change in net operating income (b ÷ a)....
30%
5-1
Chapter 5 Cost-Volume-Profit Relationships
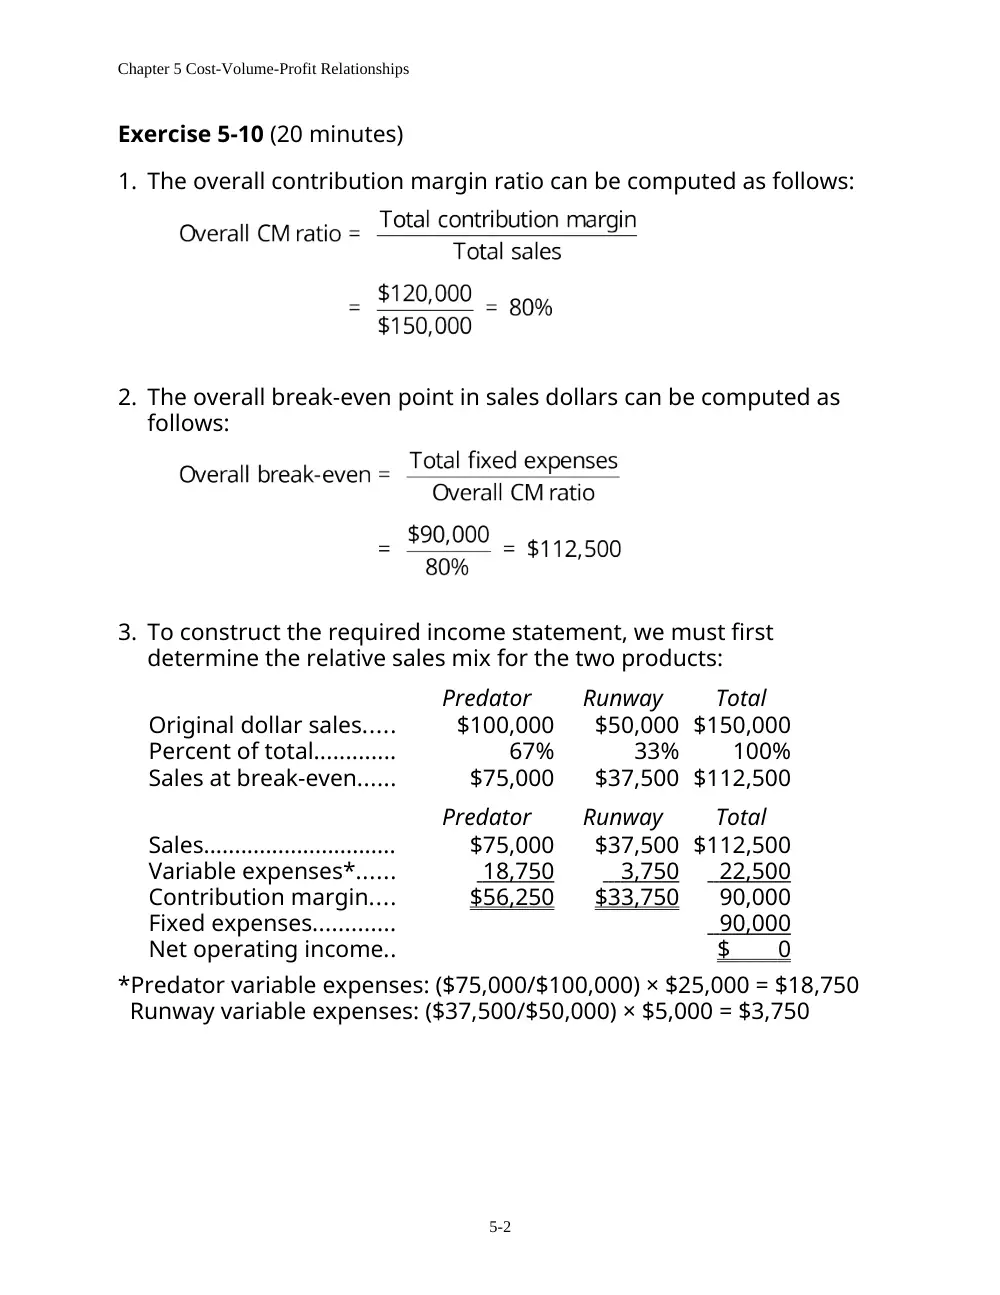
Exercise 5-10 (20 minutes)
1. The overall contribution margin ratio can be computed as follows:
2. The overall break-even point in sales dollars can be computed as
follows:
3. To construct the required income statement, we must first
determine the relative sales mix for the two products:
Predator
Runway
Total
Original dollar sales.....
$100,000
$50,000 $150,000
Percent of total.............
67%
33%
100%
Sales at break-even......
$75,000
$37,500 $112,500
Predator
Runway
Total
Sales...............................
$75,000
$37,500 $112,500
Variable expenses*......
18,750
3,750
22,500
Contribution margin....
$56,250
$33,750
90,000
Fixed expenses.............
90,000
Net operating income..
$ 0
*Predator variable expenses: ($75,000/$100,000) × $25,000 = $18,750
Runway variable expenses: ($37,500/$50,000) × $5,000 = $3,750
5-2
Chapter 5 Cost-Volume-Profit Relationships
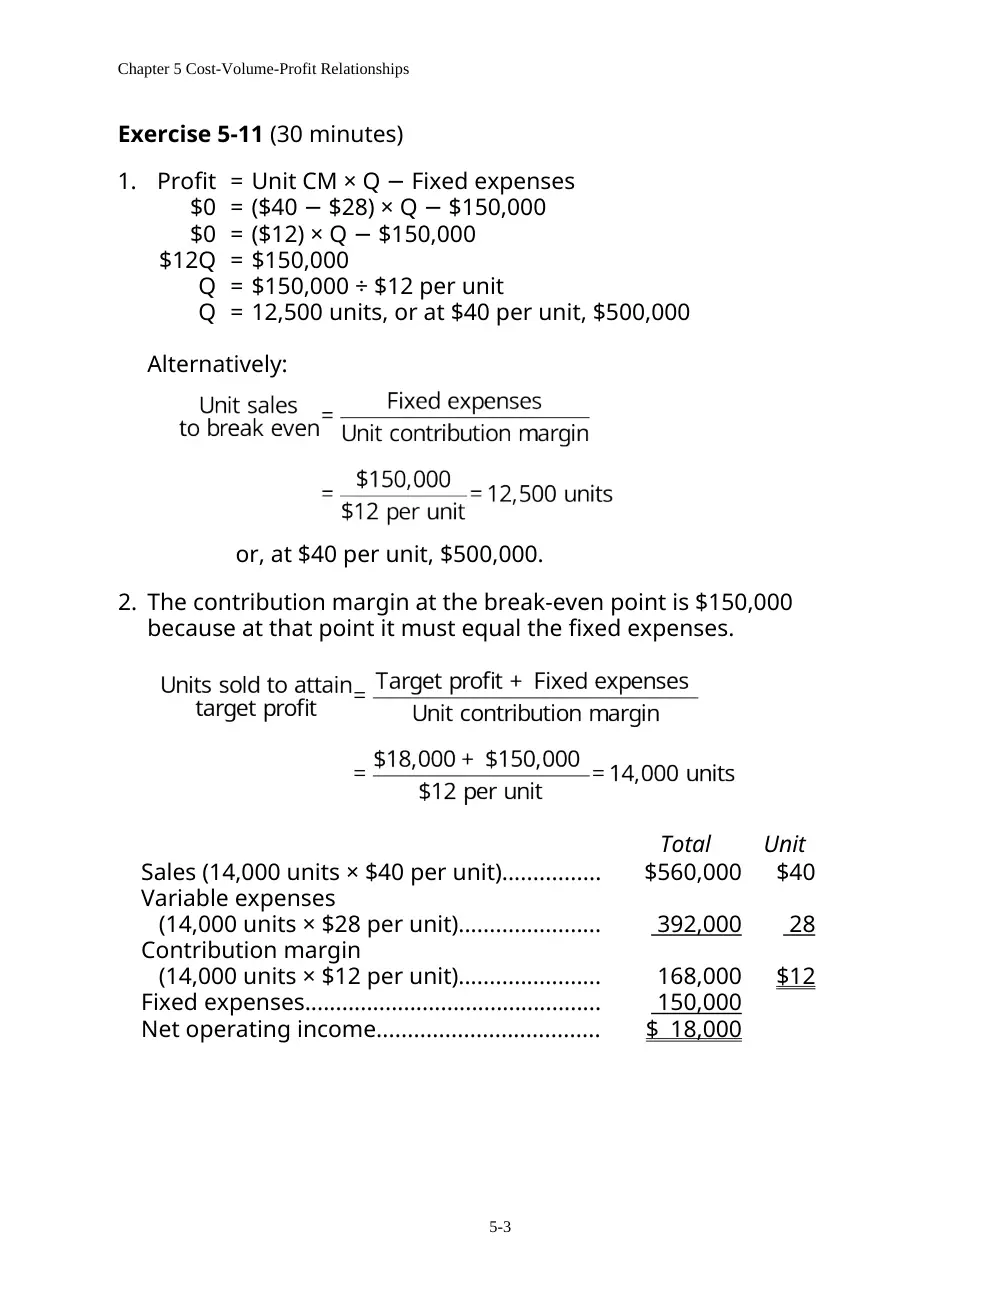
Exercise 5-11 (30 minutes)
1.
Profit = Unit CM × Q
Fixed expenses
−
$0 = ($40
$28) × Q
$150,000
−
−
$0 = ($12) × Q
$150,000
−
$12Q = $150,000
Q = $150,000 ÷ $12 per unit
Q = 12,500 units, or at $40 per unit, $500,000
Alternatively:
or, at $40 per unit, $500,000.
2. The contribution margin at the break-even point is $150,000
because at that point it must equal the fixed expenses.
Total
Unit
Sales (14,000 units × $40 per unit)................
$560,000
$40
Variable expenses
(14,000 units × $28 per unit).......................
392,000
28
Contribution margin
(14,000 units × $12 per unit).......................
168,000
$12
Fixed expenses................................................
150,000
Net operating income....................................
$ 18,000
5-3
Chapter 5 Cost-Volume-Profit Relationships
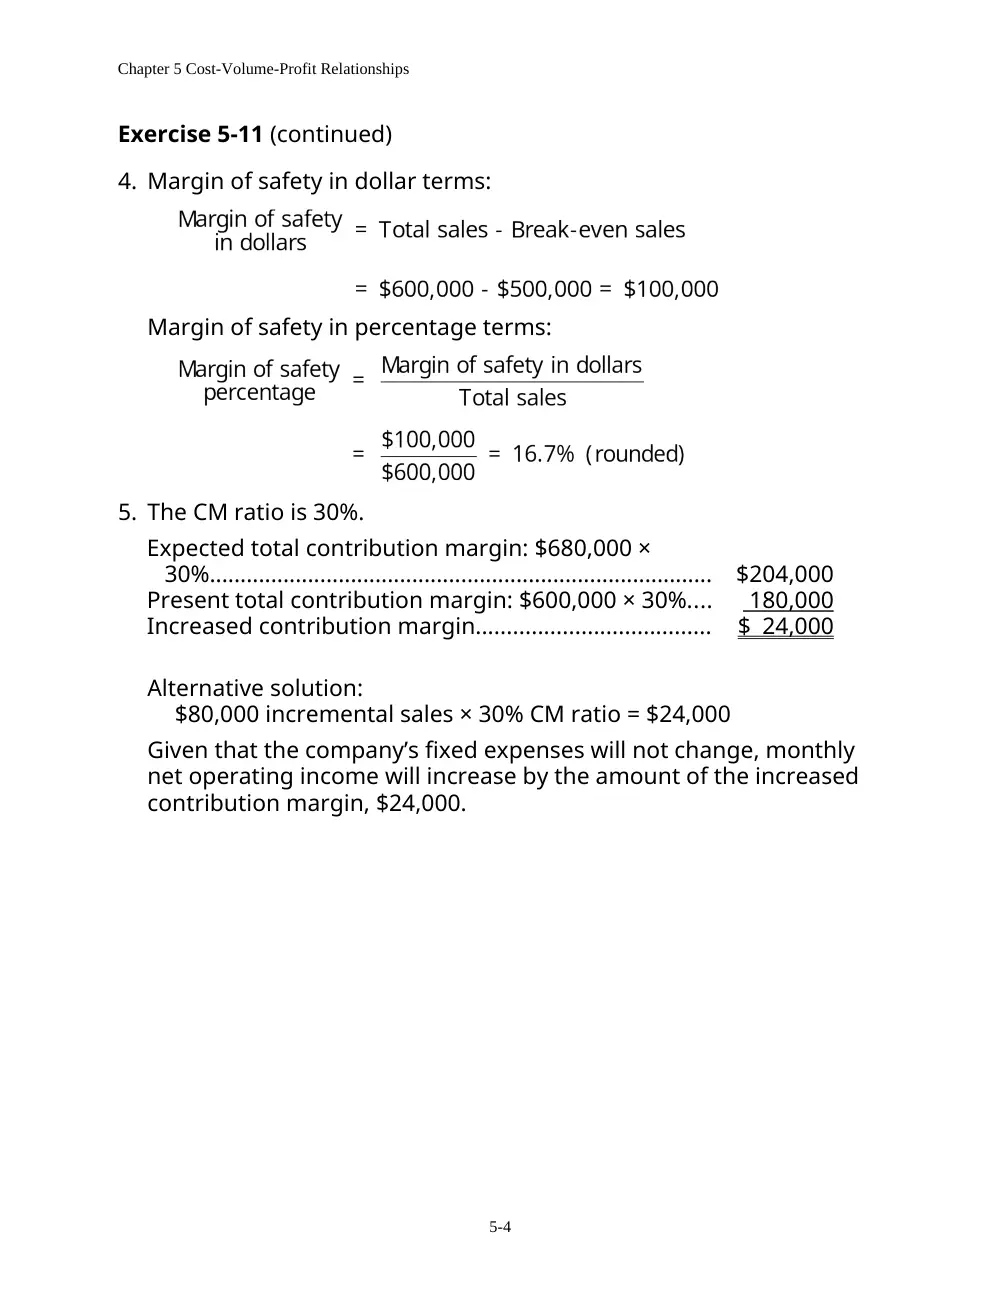
Exercise 5-11 (continued)
4. Margin of safety in dollar terms:
Margin of safety in percentage terms:
5. The CM ratio is 30%.
Expected total contribution margin: $680,000 ×
30%..................................................................................
$204,000
Present total contribution margin: $600,000 × 30%....
180,000
Increased contribution margin......................................
$ 24,000
Alternative solution:
$80,000 incremental sales × 30% CM ratio = $24,000
Given that the company’s fixed expenses will not change, monthly
net operating income will increase by the amount of the increased
contribution margin, $24,000.
5-4
Chapter 5 Cost-Volume-Profit Relationships
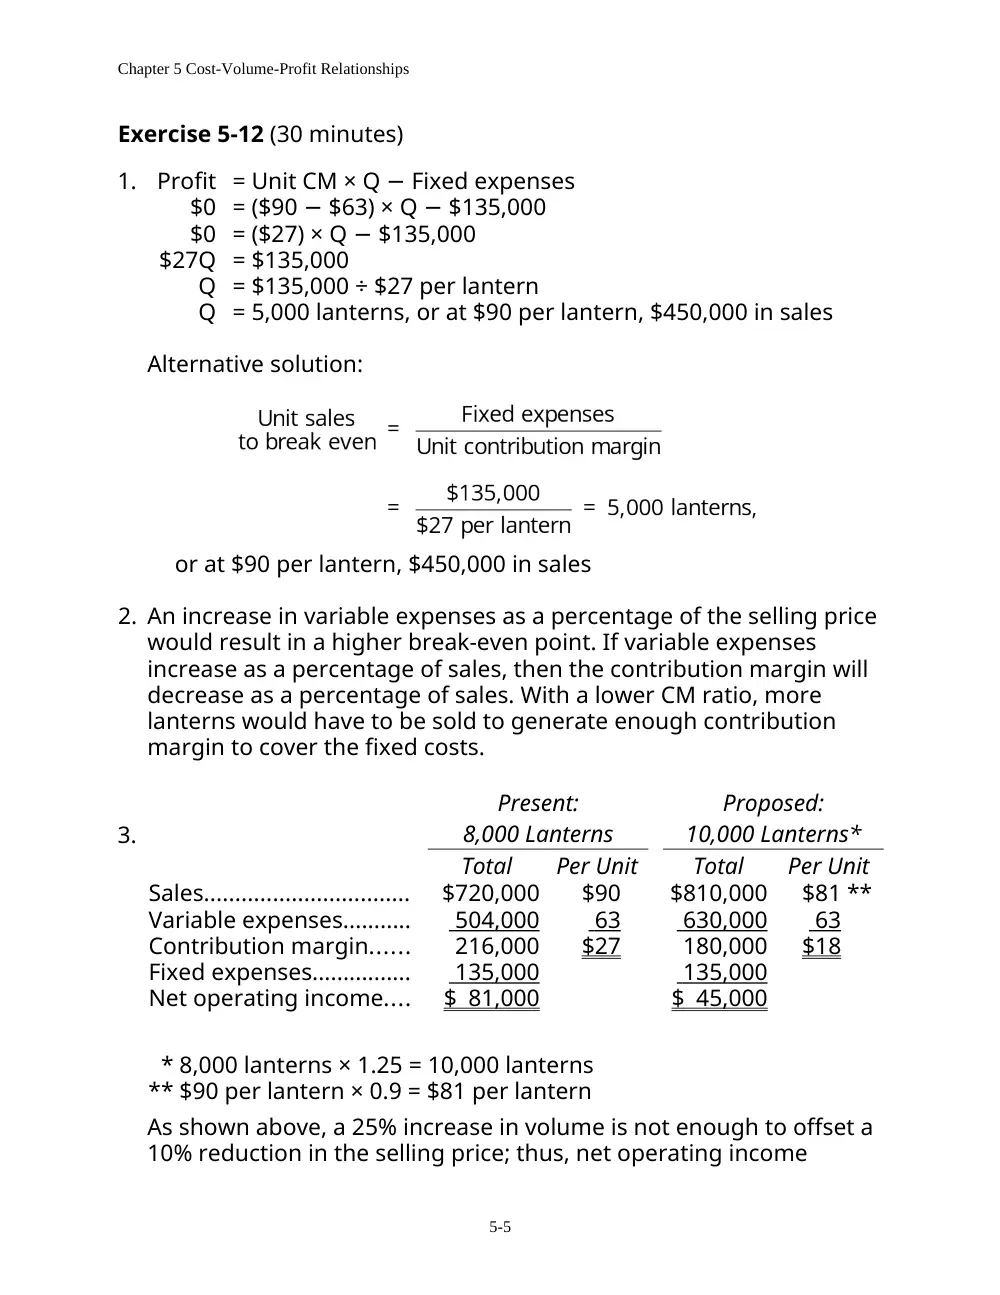
Exercise 5-12 (30 minutes)
1.
Profit = Unit CM × Q
Fixed expenses
−
$0 = ($90
$63) × Q
$135,000
−
−
$0 = ($27) × Q
$135,000
−
$27Q = $135,000
Q = $135,000 ÷ $27 per lantern
Q = 5,000 lanterns, or at $90 per lantern, $450,000 in sales
Alternative solution:
or at $90 per lantern, $450,000 in sales
2. An increase in variable expenses as a percentage of the selling price
would result in a higher break-even point. If variable expenses
increase as a percentage of sales, then the contribution margin will
decrease as a percentage of sales. With a lower CM ratio, more
lanterns would have to be sold to generate enough contribution
margin to cover the fixed costs.
3.
Present:
8,000 Lanterns
Proposed:
10,000 Lanterns*
Total
Per Unit
Total
Per Unit
Sales.................................
$720,000
$90
$810,000
$81 **
Variable expenses...........
504,000
63
630,000
63
Contribution margin......
216,000
$27
180,000
$18
Fixed expenses................
135,000
135,000
Net operating income....
$ 81,000
$ 45,000
* 8,000 lanterns × 1.25 = 10,000 lanterns
** $90 per lantern × 0.9 = $81 per lantern
As shown above, a 25% increase in volume is not enough to offset a
10% reduction in the selling price; thus, net operating income
5-5
Chapter 5 Cost-Volume-Profit Relationships
decreases.
5-6
Chapter 5 Cost-Volume-Profit Relationships
Exercise 5-12 (continued)
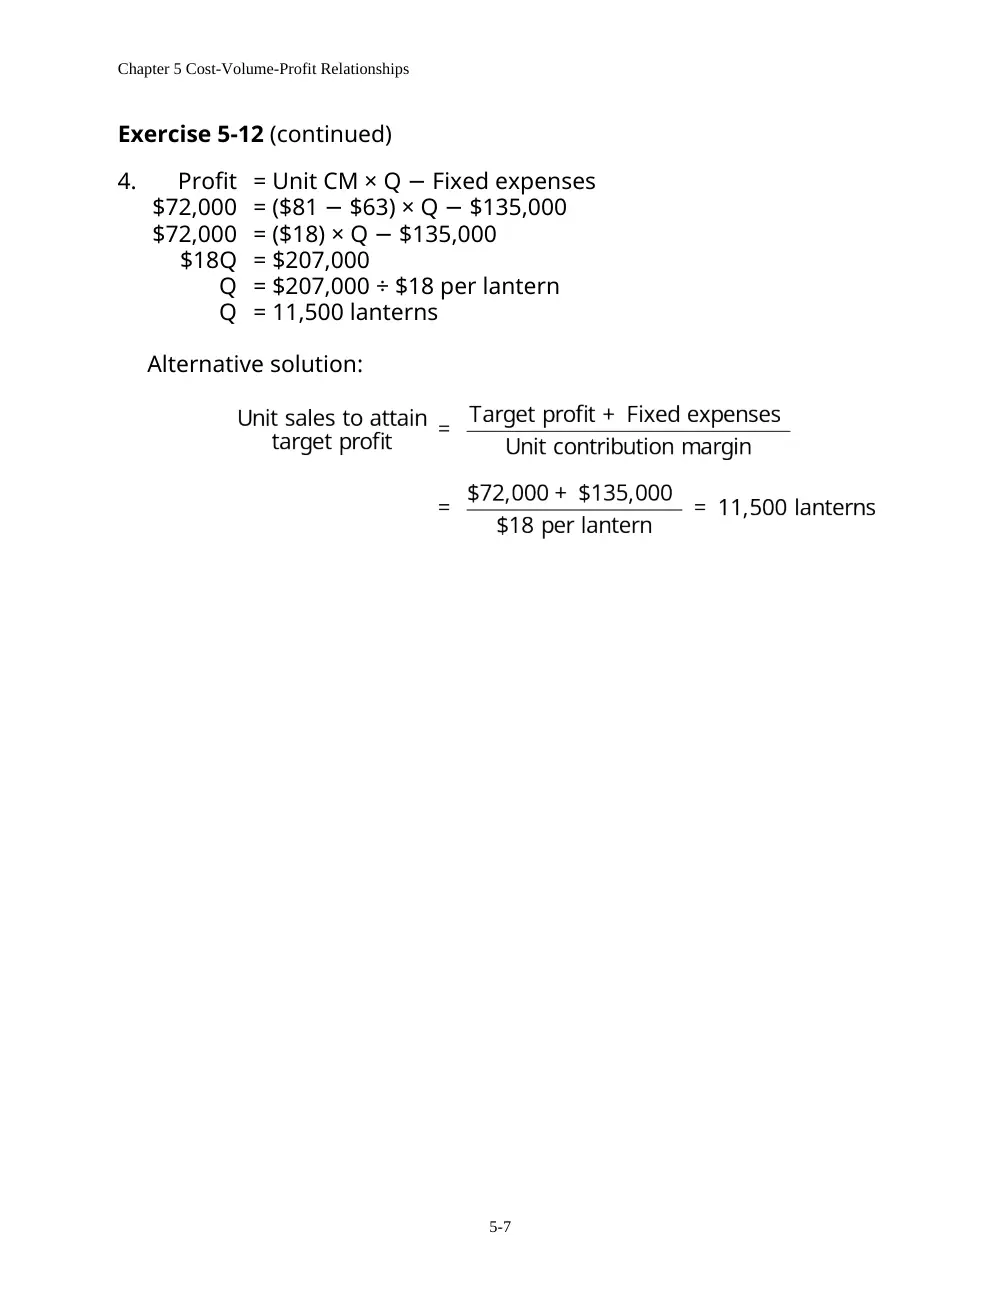
4.
Profit = Unit CM × Q
Fixed expenses
−
$72,000 = ($81
$63) × Q
$135,000
−
−
$72,000 = ($18) × Q
$135,000
−
$18Q = $207,000
Q = $207,000 ÷ $18 per lantern
Q = 11,500 lanterns
Alternative solution:
5-7
Chapter 5 Cost-Volume-Profit Relationships
Exercise 5-14 (30 minutes)
1.
Model A100
Model B900
Total Company
Amount
%
Amount
%
Amount
%
Sales................. $700,000 100
$300,000 100
$1,000,000 100
Variable
expenses......
280,000
40
90,000
30
370,000
37
Contribution
margin.......... $420,000
60
$210,000
70
630,000
63
*
Fixed
expenses......
598,500
Net operating
income..........
$ 31,500
*630,000 ÷ $1,000,000 = 63%.
2. The break-even point for the company as a whole is:
3. The additional contribution margin from the additional sales is
computed as follows:
$50,000 × 63% CM ratio = $31,500
Assuming no change in fixed expenses, all of this additional
contribution margin should drop to the bottom line as increased net
operating income.
This answer assumes no change in selling prices, variable costs
per unit, fixed expenses, or sales mix.
5-8
Chapter 5 Cost-Volume-Profit Relationships
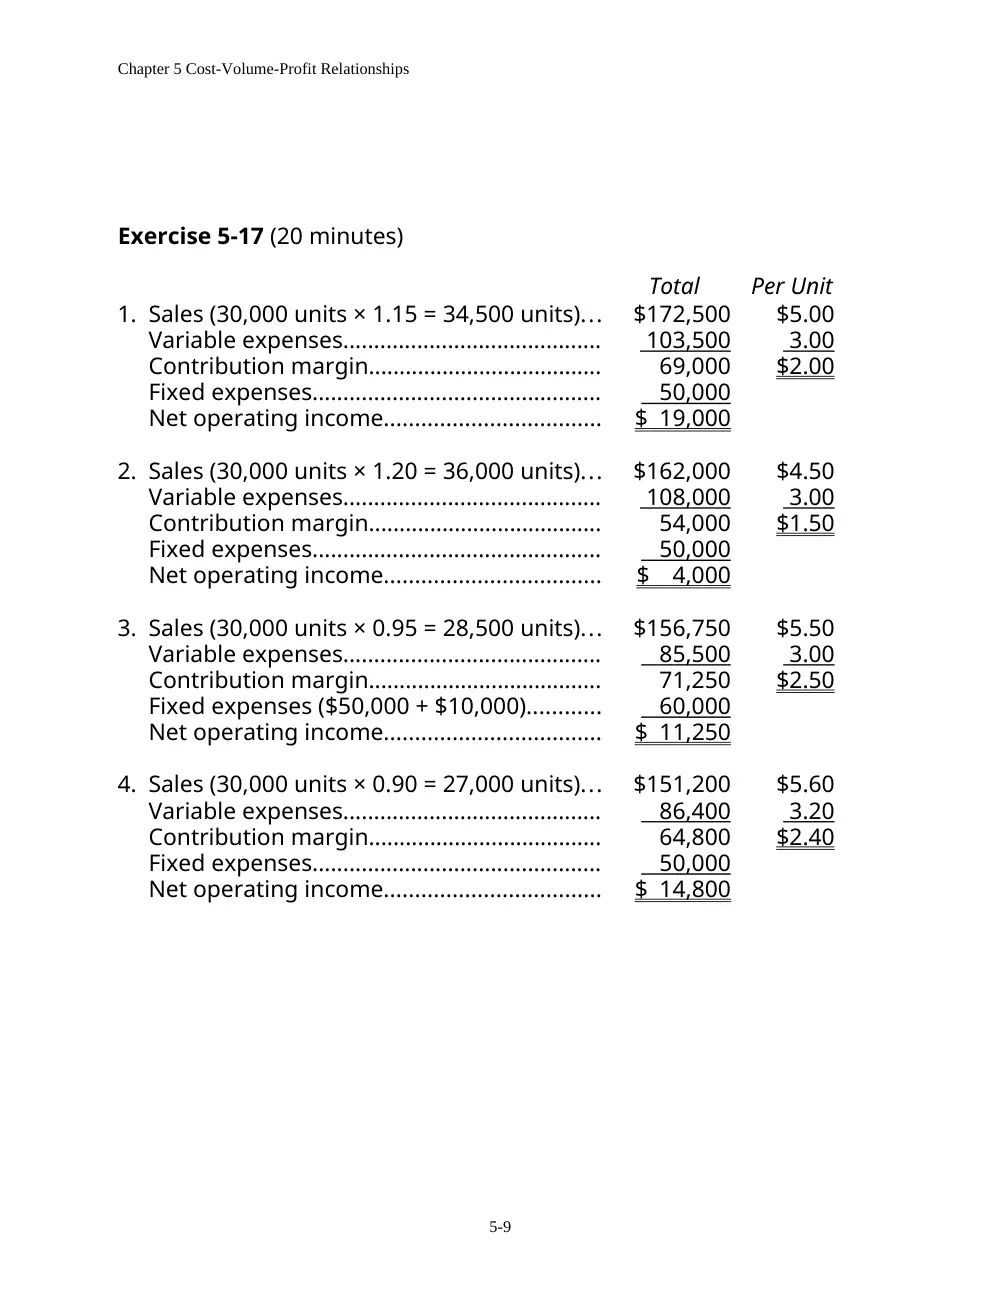
Exercise 5-17 (20 minutes)
Total
Per Unit
1. Sales (30,000 units × 1.15 = 34,500 units)...
$172,500
$5.00
Variable expenses..........................................
103,500
3.00
Contribution margin......................................
69,000
$2.00
Fixed expenses...............................................
50,000
Net operating income...................................
$ 19,000
2. Sales (30,000 units × 1.20 = 36,000 units)...
$162,000
$4.50
Variable expenses..........................................
108,000
3.00
Contribution margin......................................
54,000
$1.50
Fixed expenses...............................................
50,000
Net operating income...................................
$ 4,000
3. Sales (30,000 units × 0.95 = 28,500 units)...
$156,750
$5.50
Variable expenses..........................................
85,500
3.00
Contribution margin......................................
71,250
$2.50
Fixed expenses ($50,000 + $10,000)............
60,000
Net operating income...................................
$ 11,250
4. Sales (30,000 units × 0.90 = 27,000 units)...
$151,200
$5.60
Variable expenses..........................................
86,400
3.20
Contribution margin......................................
64,800
$2.40
Fixed expenses...............................................
50,000
Net operating income...................................
$ 14,800
5-9
Chapter 5 Cost-Volume-Profit Relationships
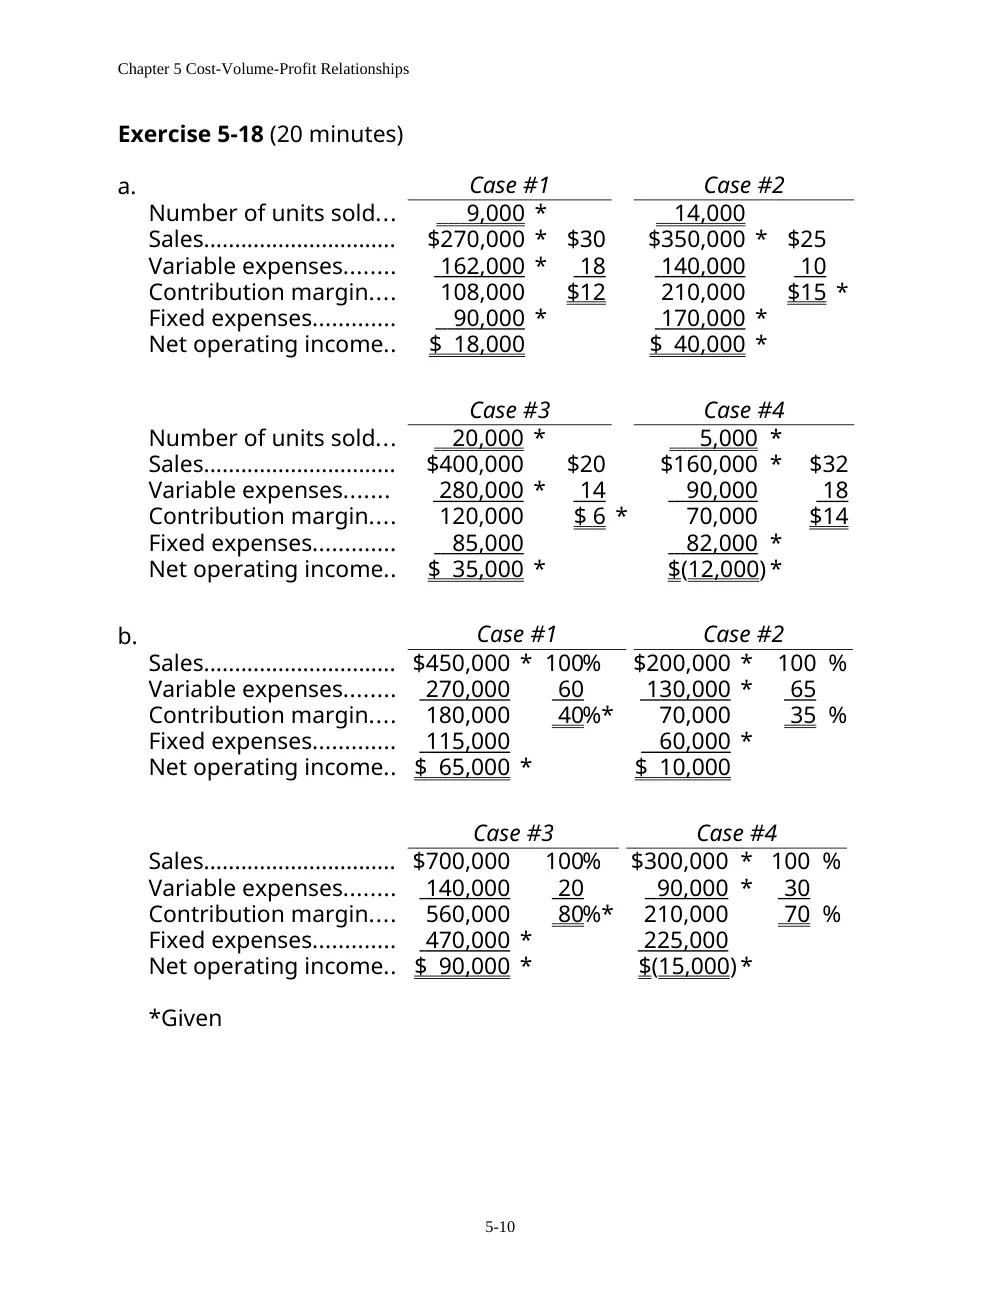
Exercise 5-18 (20 minutes)
a.
Case #1
Case #2
Number of units sold...
9,000
*
14,000
Sales...............................
$270,000 *
$30
$350,000 *
$25
Variable expenses........
162,000
*
18
140,000
10
Contribution margin....
108,000
$12
210,000
$15 *
Fixed expenses.............
90,000
*
170,000
*
Net operating income..
$ 18,000
$ 40,000 *
Case #3
Case #4
Number of units sold...
20,000
*
5,000
*
Sales...............................
$400,000
$20
$160,000 *
$32
Variable expenses.......
280,000
*
14
90,000
18
Contribution margin....
120,000
$ 6 *
70,000
$14
Fixed expenses.............
85,000
82,000
*
Net operating income..
$ 35,000 *
$(12,000) *
b.
Case #1
Case #2
Sales............................... $450,000 * 100%
$200,000 *
100 %
Variable expenses........
270,000
60
130,000
*
65
Contribution margin....
180,000
40
%*
70,000
35
%
Fixed expenses.............
115,000
60,000
*
Net operating income.. $ 65,000 *
$ 10,000
Case #3
Case #4
Sales............................... $700,000
100%
$300,000 * 100 %
Variable expenses........
140,000
20
90,000
*
30
Contribution margin....
560,000
80
%*
210,000
70
%
Fixed expenses.............
470,000
*
225,000
Net operating income.. $ 90,000 *
$(15,000) *
*Given
5-10
Chapter 5 Cost-Volume-Profit Relationships
Problem 5-20 (60 minutes)
1. The CM ratio is 30%.
Total
Per Unit
Percentage
Sales (13,500 units).........
$270,000
$20
100%
Variable expenses...........
189,000
14
70%
Contribution margin.......
$ 81,000
$ 6
30%
The break-even point is:
Profit = Unit CM × Q
Fixed expenses
−
$0 = ($20
$14) × Q
$90,000
−
−
$0 = ($6) × Q
− $90,000
$6Q = $90,000
Q = $90,000 ÷ $6 per unit
Q = 15,000 units
15,000 units × $20 per unit = $300,000 in sales
Alternative solution:
2. Incremental contribution margin:
$70,000 increased sales × 30% CM ratio............
$21,000
Less increased fixed costs:
Increased advertising cost..................................
8,000
Increase in monthly net operating income..........
$13,000
Since the company presently has a loss of $9,000 per month, if the
5-11
Chapter 5 Cost-Volume-Profit Relationships
changes are adopted, the loss will turn into a profit of $4,000 per
month.
5-12
Chapter 5 Cost-Volume-Profit Relationships
Problem 5-20 (continued)
3. Sales (27,000 units × $18 per unit*)...............
$486,000
Variable expenses
(27,000 units × $14 per unit)........................
378,000
Contribution margin........................................
108,000
Fixed expenses ($90,000 + $35,000)..............
125,000
Net operating loss............................................
$(17,000)
*$20 – ($20 × 0.10) = $18
4.
Profit = Unit CM × Q
Fixed expenses
−
$4,500 = ($20.00
$14.60*) × Q
$90,000
−
−
$4,500 = ($5.40) × Q
$90,000
−
$5.40Q = $94,500
Q = $94,500 ÷ $5.40 per unit
Q = 17,500 units
*$14.00 + $0.60 = $14.60.
Alternative solution:
**$6.00 – $0.60 = $5.40.
5. a. The new CM ratio would be:
Per Unit
Percentage
Sales................................................
$20
100%
Variable expenses.........................
7
35%
Contribution margin.....................
$13
65%
5-13
Chapter 5 Cost-Volume-Profit Relationships
Problem 5-20 (continued)
The new break-even point would be:
b. Comparative income statements follow:
Not Automated
Automated
Total
Per Unit
%
Total
Per Unit
%
Sales (20,000 units)....
$400,000
$20
100
$400,000
$20
100
Variable expenses......
280,000
14
70
140,000
7
35
Contribution margin..
120,000
$ 6
30
260,000
$13
65
Fixed expenses...........
90,000
208,000
Net operating income
$ 30,000
$ 52,000
5-14
Chapter 5 Cost-Volume-Profit Relationships
Problem 5-20 (continued)
c. Whether or not one would recommend that the company
automate its operations depends on how much risk he or she is
willing to take, and depends heavily on prospects for future sales.
The proposed changes would increase the company’s fixed costs
and its break-even point. However, the changes would also
increase the company’s CM ratio (from 30% to 65%). The higher
CM ratio means that once the break-even point is reached, profits
will increase more rapidly than at present. If 20,000 units are sold
next month, for example, the higher CM ratio will generate
$22,000 more in profits than if no changes are made.
The greatest risk of automating is that future sales may drop
back down to present levels (only 13,500 units per month), and as
a result, losses will be even larger than at present due to the
company’s greater fixed costs. (Note the problem states that
sales are erratic from month to month.) In sum, the proposed
changes will help the company if sales continue to trend upward
in future months; the changes will hurt the company if sales drop
back down to or near present levels.
Note to the Instructor: Although it is not asked for in the problem,
if time permits you may want to compute the point of
indifference between the two alternatives in terms of units sold;
i.e., the point where profits will be the same under either
alternative. At this point, total revenue will be the same; hence,
we include only costs in our equation:
Let Q = Point of indifference in units sold
$14Q + $90,000 = $7Q + $208,000
$7Q = $118,000
Q = $118,000 ÷ $7 per unit
Q = 16,857 units (rounded)
If more than 16,857 units are sold, the proposed plan
will yield the greatest profit; if less than 16,857 units are sold, the
present plan will yield the greatest profit (or the least loss).
5-15
Chapter 5 Cost-Volume-Profit Relationships
Problem 5-21 (60 minutes)
1. The CM ratio is 60%:
Selling price........................
$15
100%
Variable expenses..............
6
40%
Contribution margin.........
$ 9
60%
2.
3. $45,000 increased sales × 60% CM ratio = $27,000 increase in
contribution margin. Since fixed costs will not change, net operating
income should also increase by $27,000.
4. a.
b. 6 × 15% = 90% increase in net operating income. In dollars, this
increase would be 90% × $36,000 = $32,400.
5-16
Chapter 5 Cost-Volume-Profit Relationships
Problem 5-21 (continued)
5.
Last Year:
28,000 units
Proposed:
42,000 units*
Total
Per Unit
Total
Per Unit
Sales...............................
$420,000
$15.00
$567,000
$13.50**
Variable expenses........
168,000
6.00
252,000
6.00
Contribution margin....
252,000
$ 9.00
315,000
$ 7.50
Fixed expenses.............
180,000
250,000
Net operating income..
$ 72,000
$ 65,000
* 28,000 units × 1.5 = 42,000 units
** $15 per unit × 0.90 = $13.50 per unit
No, the changes should not be made.
6. Expected total contribution margin:
28,000 units × 200% × $7 per unit*....................
$392,000
Present total contribution margin:
28,000 units × $9 per unit....................................
252,000
Incremental contribution margin, and the
amount by which advertising can be
increased with net operating income
remaining unchanged.........................................
$140,000
*$15 – ($6 + $2) = $7
5-17
Chapter 5 Cost-Volume-Profit Relationships
Problem 5-24 (60 minutes)
1. April's Income Statement:
Standard
Deluxe
Pro
Total
Amount
%
Amount
%
Amount
%
Amount
%
Sales...............................
$80,000 100
$60,000 100
$450,000 100
$590,000
100
Variable expenses:
Production..................
44,000
55
27,000
45
157,500
35
228,500
38.7
Selling..........................
4,000
5
3,000
5
22,500
5
29,500
5.0
Total variable expenses
48,000
60
30,000
50
180,000
40
258,000
43.7
Contribution margin....
$32,000
40
$30,000
50
$270,000
60
332,000
56.3
Fixed expenses:
Production..................
120,000
Advertising..................
100,000
Administrative............
50,000
Total fixed expenses......
270,000
Net operating income...
$ 62,000
5-18
Chapter 5 Cost-Volume-Profit Relationships
Problem 5-24 (continued)
May's Income Statement:
Standard
Deluxe
Pro
Total
Amount
%
Amount
%
Amount
%
Amount
%
Sales.............................. $320,000 100
$60,000 100
$270,000 100
$650,000 100.0
Variable expenses:
Production.................
176,000
55
27,000
45
94,500
35
297,500
45.8
Selling.........................
16,000
5
3,000
5
13,500
5
32,500
5.0
Total variable
expenses....................
192,000
60
30,000
50
108,000
40
330,000
50.8
Contribution margin.... $128,000
40
$30,000
50
$162,000
60
320,000
49.2
Fixed expenses:
Production.................
120,000
Advertising.................
100,000
Administrative...........
50,000
Total fixed expenses....
270,000
Net operating income.
$ 50,000
5-19
Chapter 5 Cost-Volume-Profit Relationships
Problem 5-24 (continued)
2. The sales mix has shifted over the last month from a greater
concentration of Pro rackets to a greater concentration of Standard
rackets. This shift has caused a decrease in the company’s overall
CM ratio from 56.3% in April to only 49.2% in May. For this reason,
even though total sales (both in units and in dollars) is greater, net
operating income is lower than last month in the division.
3. The break-even in dollar sales can be computed as follows:
4. May’s break-even point has gone up. The reason is that the division’s
overall CM ratio has declined for May as stated in (2) above.
Unchanged fixed expenses divided by a lower overall CM ratio would
yield a higher break-even point in sales dollars.
5.
Standard
Pro
Increase in sales......................................
$20,000
$20,000
Multiply by the CM ratio.........................
× 40%
× 60%
Increase in net operating income*......
$ 8,000
$12,000
*Assuming that fixed costs do not change.
5-20
Chapter 5 Cost-Volume-Profit Relationships
Problem 5-29 (75 minutes)
1. a. Selling price.......................
$37.50
100%
Variable expenses............
22.50
60%
Contribution margin........
$15.00
40%
Profit = Unit CM × Q − Fixed expenses
$0 = $15 × Q − $480,000
$15Q = $480,000
Q = $480,000 ÷ $15 per skateboard
Q = 32,000 skateboards
Alternative solution:
b. The degree of operating leverage would be:
2. The new CM ratio will be:
Selling price.............................
$37.50
100%
Variable expenses..................
25.50
68%
Contribution margin..............
$12.00
32%
5-21
Chapter 5 Cost-Volume-Profit Relationships
Problem 5-29 (continued)
The new break-even point will be:
Profit = Unit CM × Q − Fixed expenses
$0 = $12 × Q − $480,000
$12Q = $480,000
Q = $480,000 ÷ $12 per skateboard
Q = 40,000 skateboards
Alternative solution:
3.
Profit = Unit CM × Q − Fixed expenses
$120,000 = $12 × Q − $480,000
$12Q = $120,000 + $480,000
Q = $600,000 ÷ $12 per skateboard
Q = 50,000 skateboards
Alternative solution:
5-22
Chapter 5 Cost-Volume-Profit Relationships
Problem 5-29 (continued)
Thus, sales will have to increase by 10,000 skateboards (50,000
skateboards, less 40,000 skateboards currently being sold) to earn
the same amount of net operating income as earned last year. The
computations above and in part (2) show the dramatic effect that
increases in variable costs can have on an organization. These
effects from a $3 per unit increase in labor costs for Tyrene
Company are summarized below:
Present
Expected
Break-even point (in skateboards)..........
32,000
40,000
Sales (in skateboards) needed to earn
net operating income of $120,000.......
40,000
50,000
Note that if variable costs do increase next year, then the company
will just break even if it sells the same number of skateboards
(40,000) as it did last year.
4. The contribution margin ratio last year was 40%. If we let P equal
the new selling price, then:
P = $25.50 + 0.40P
0.60P = $25.50
P = $25.50 ÷ 0.60
P = $42.50
To verify:
Selling price...............................
$42.50
100%
Variable expenses....................
25.50
60%
Contribution margin................
$17.00
40%
Therefore, to maintain a 40% CM ratio, a $3 increase in variable
costs would require a $5 increase in the selling price.
5-23
Chapter 5 Cost-Volume-Profit Relationships
Problem 5-29 (continued)
5. The new CM ratio would be:
Selling price..........................
$37.50
100%
Variable expenses................
13.50
*
36%
Contribution margin............
$24.00
64%
*$22.50 – ($22.50 × 40%) = $13.50
The new break-even point would be:
Profit = Unit CM × Q − Fixed expenses
$0 = $24 × Q − $912,000*
$24Q = $912,000
Q = $912,000 ÷ $24 per skateboard
Q = 38,000 skateboards
*$480,000 × 1.9 = $912,000
Alternative solution:
Although this break-even figure is greater than the company’s
present break-even figure of 32,000 skateboards [see part (1)
above], it is less than the break-even point will be if the company
does not automate and variable labor costs rise next year [see part
(2) above].
5-24
Chapter 5 Cost-Volume-Profit Relationships
Problem 5-29 (continued)
6.
a.
Profit = Unit CM × Q − Fixed expenses
$120,000 = $24 × Q − $912,000*
$24Q = $120,000 + $912,000
Q = $1,032,000 ÷ $24.00 per skateboard
Q = 43,000 skateboards
*480,000 × 1.9 = $912,000
Alternative solution:
Thus, the company will have to sell 3,000 more skateboards
(43,000 – 40,000 = 3,000) than now being sold to earn a profit of
$120,000 each year. However, this is still less than the 50,000
skateboards that would have to be sold to earn a $120,000 profit
if the plant is not automated and variable labor costs rise next
year [see part (3) above].
5-25
Chapter 5 Cost-Volume-Profit Relationships
Problem 5-29 (continued)
b. The contribution income statement would be:
Sales
(40,000 skateboards × $37.50 per skateboard)
$1,500,000
Variable expenses
(40,000 skateboards × $13.50 per skateboard)
540,000
Contribution margin...............................................
960,000
Fixed expenses........................................................
912,000
Net operating income.............................................
$ 48,000
c. This problem shows the difficulty faced by some companies.
When variable labor costs increase, it is often difficult to pass
these cost increases along to customers in the form of higher
prices. Thus, companies are forced to automate, resulting in
higher operating leverage, often a higher break-even point, and
greater risk for the company.
There is no clear answer as to whether one should have been in
favor of constructing the new plant.
5-26