
EECE 210 Chapter 7, Fall 2012
American University of Beirut · Electric Circuits · 16 pages
Showing the first 10 of 16 pages. Download the PDF to see all of it.
More EECE 210 files
- Chapter Uploading Chapter 08 Sinusoidal Steady · Spring 2015ChapterView
- Homework All Chapters · Fall 2015ChapterView
- Chapter 1 · Fall 2012ChapterView
- Chapter 2 · Fall 2012ChapterView
- Chapter 3 · Fall 2012ChapterView
- Chapter 4 · Fall 2012ChapterView
- Chapter 5 · Fall 2012ChapterView
- Chapter 6 · Fall 2012ChapterView
Show the text of this chapter
Chapter 7
Power Relations and Circuit Measurements
7.1
Instantaneous and Average Power
Resistor
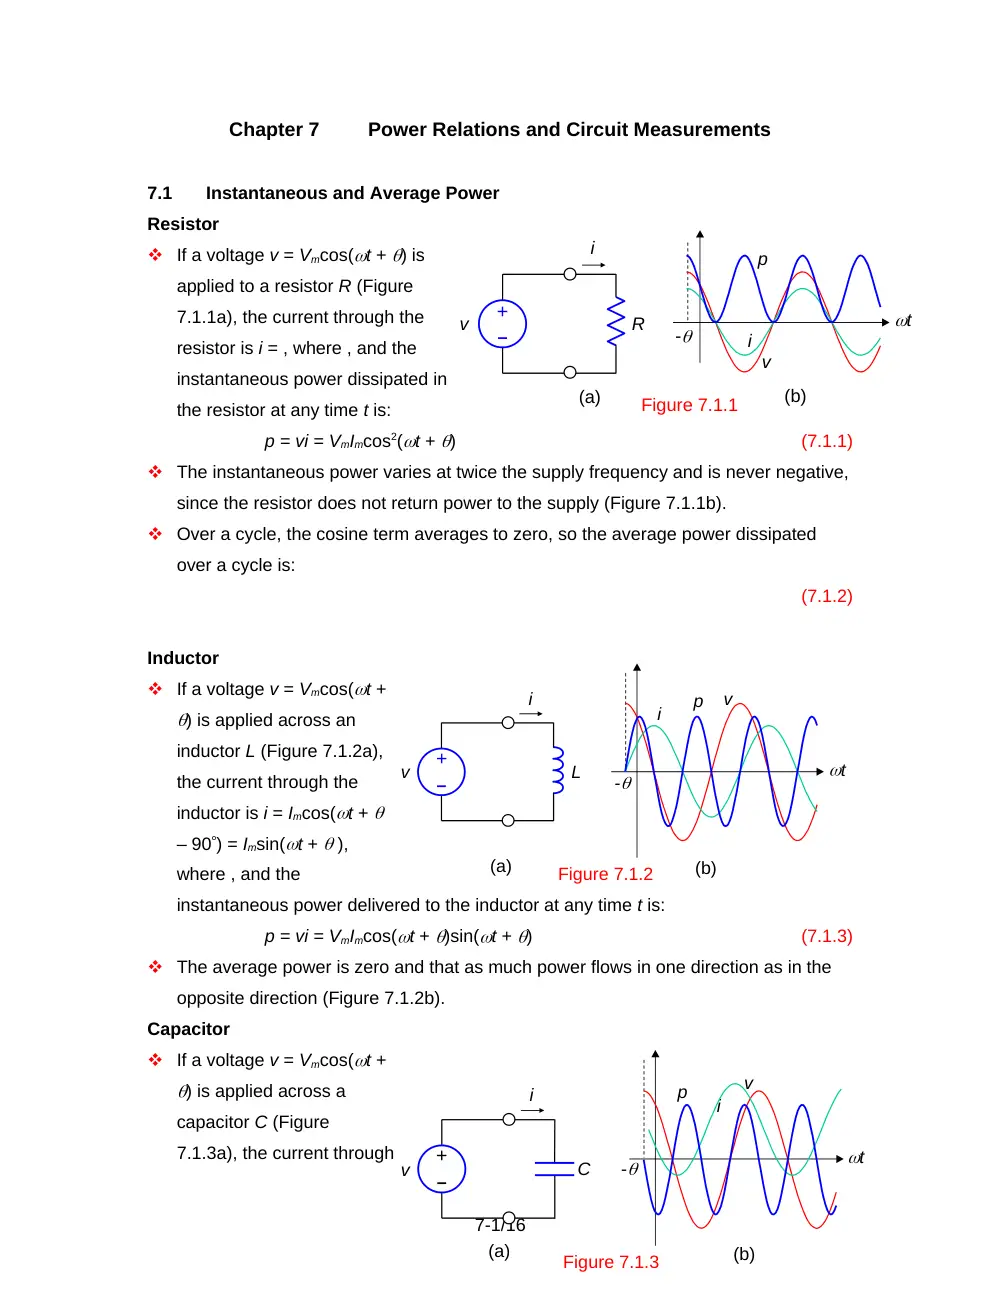
If a voltage v = Vmcos(t + ) is
applied to a resistor R (Figure
7.1.1a), the current through the
resistor is i = , where , and the
instantaneous power dissipated in
the resistor at any time t is:
p = vi = VmImcos2(t + )
(7.1.1)
The instantaneous power varies at twice the supply frequency and is never negative,
since the resistor does not return power to the supply (Figure 7.1.1b).
Over a cycle, the cosine term averages to zero, so the average power dissipated
over a cycle is:
(7.1.2)
Inductor
If a voltage v = Vmcos(t +
) is applied across an
inductor L (Figure 7.1.2a),
the current through the
inductor is i = Imcos(t +
– 90) = Imsin(t + ),
where , and the
instantaneous power delivered to the inductor at any time t is:
p = vi = VmImcos(t + )sin(t + )
(7.1.3)
The average power is zero and that as much power flows in one direction as in the
opposite direction (Figure 7.1.2b).
Capacitor
If a voltage v = Vmcos(t +
) is applied across a
capacitor C (Figure
7.1.3a), the current through
7-1/16
v
R
i
(a)
(b)
Figure 7.1.1
p
v
i
-
t
–
+
t
L
i
(a)
(b)
p
v
i
-
v
–
+
Figure 7.1.2
C
(a)
(b)
p
v
i
-
t
v
–
+
i
Figure 7.1.3
the capacitor is i = Imcos(t + + 90) = -Imsin(t + ), where , and the instantaneous
power delivered to the capacitor at any time t is:
p = vi = -VmImcos(t + )sin(t + )
(7.1.4)
The average power is zero and as much power flows in one direction as in the
opposite direction (Figure 7.1.3b).
Concept When v and i are sinusoidal functions of time of frequency , with v being
a voltage drop in the direction of i, the instantaneous power p = vi is pulsating
at a frequency 2. If v is in phase with i, as in the case of R, p 0 and
represents power dissipated. If v and i are in phase quadrature, as in the
case of L and C, p is purely alternating, of zero average, since no power is
dissipated. In this case, when v and i have the same sign, p > 0 and
represents energy being stored in the energy-storage element. When v and i
have opposite signs, p < 0 and represents previously stored energy being
returned to the rest of the circuit.
General Case
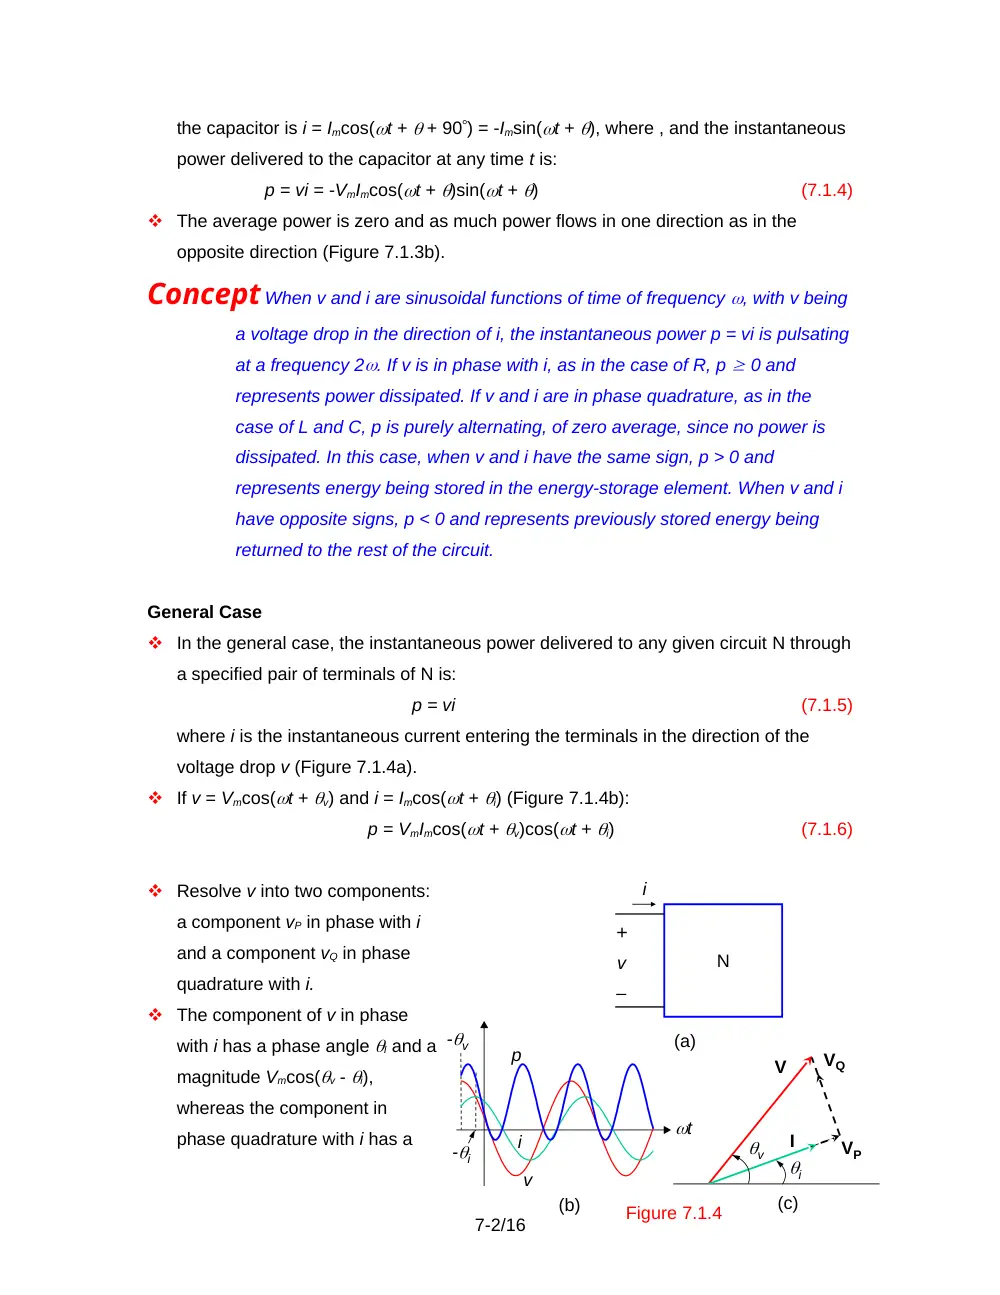
In the general case, the instantaneous power delivered to any given circuit N through
a specified pair of terminals of N is:
p = vi
(7.1.5)
where i is the instantaneous current entering the terminals in the direction of the
voltage drop v (Figure 7.1.4a).
If v = Vmcos(t + v) and i = Imcos(t + i) (Figure 7.1.4b):
p = VmImcos(t + v)cos(t + i)
(7.1.6)
Resolve v into two components:
a component vP in phase with i
and a component vQ in phase
quadrature with i.
The component of v in phase
with i has a phase angle I and a
magnitude Vmcos(v - i),
whereas the component in
phase quadrature with i has a
7-2/16
-v
(a)
(b)
N
i
–
+
v
p
v
i
-i
t
(c)
i
v
I
VP
V
VQ
Figure 7.1.4
phase angle (I + 90) and a magnitude Vmsin(v - i) (Figure 7.1.4c). Thus:
vP = [Vmcos(v - i)]cos(t + i)]
(7.1.7)
vQ = Vmsin(v - i)cos(t + i + 90) = –Vmsin(v – i)sin(t + i)
(7.1.8)
Multiplying each of the two components of v by i:
vPi = VmImcos(v – i)cos2(t + i)
= P[1 + cos2(t + i)]
(7.1.9)
where,
(7.1.10)
and
vQi = –VmImsin(v - i)cos(t + i)sin(t + i)
= Qcos[2(t + i) + 90]
(7.1.11)
where,
(7.1.12)
P is the real, or average, power. It appears in Equation 7.1.9 both as the average of
vPi, which is the power dissipated in the resistive elements of the circuit, and as the
magnitude of the alternating component of vPi.
Q is the reactive power and is the power associated with the energy that is
alternately stored and returned to the supply by the inductive and capacitive
elements of the circuit. From Equation 7.1.12, Q is the magnitude of vQi, which is
purely alternating.
For a resistor, , so Q = 0 and P = VrmsIrms, in accordance with Equation 7.1.2. For an
inductor, , so Q = VrmsIrms and P = 0. For a capacitor, , so Q = –VrmsIrms and P = 0.
Thus, Q is positive for an inductive reactance and is negative for a capacitive
reactance.
Whereas the unit of P is the watt (W), the unit of Q is the volt-ampere reactive, VAR).
Example 7.1.1
Real and Reactive Power
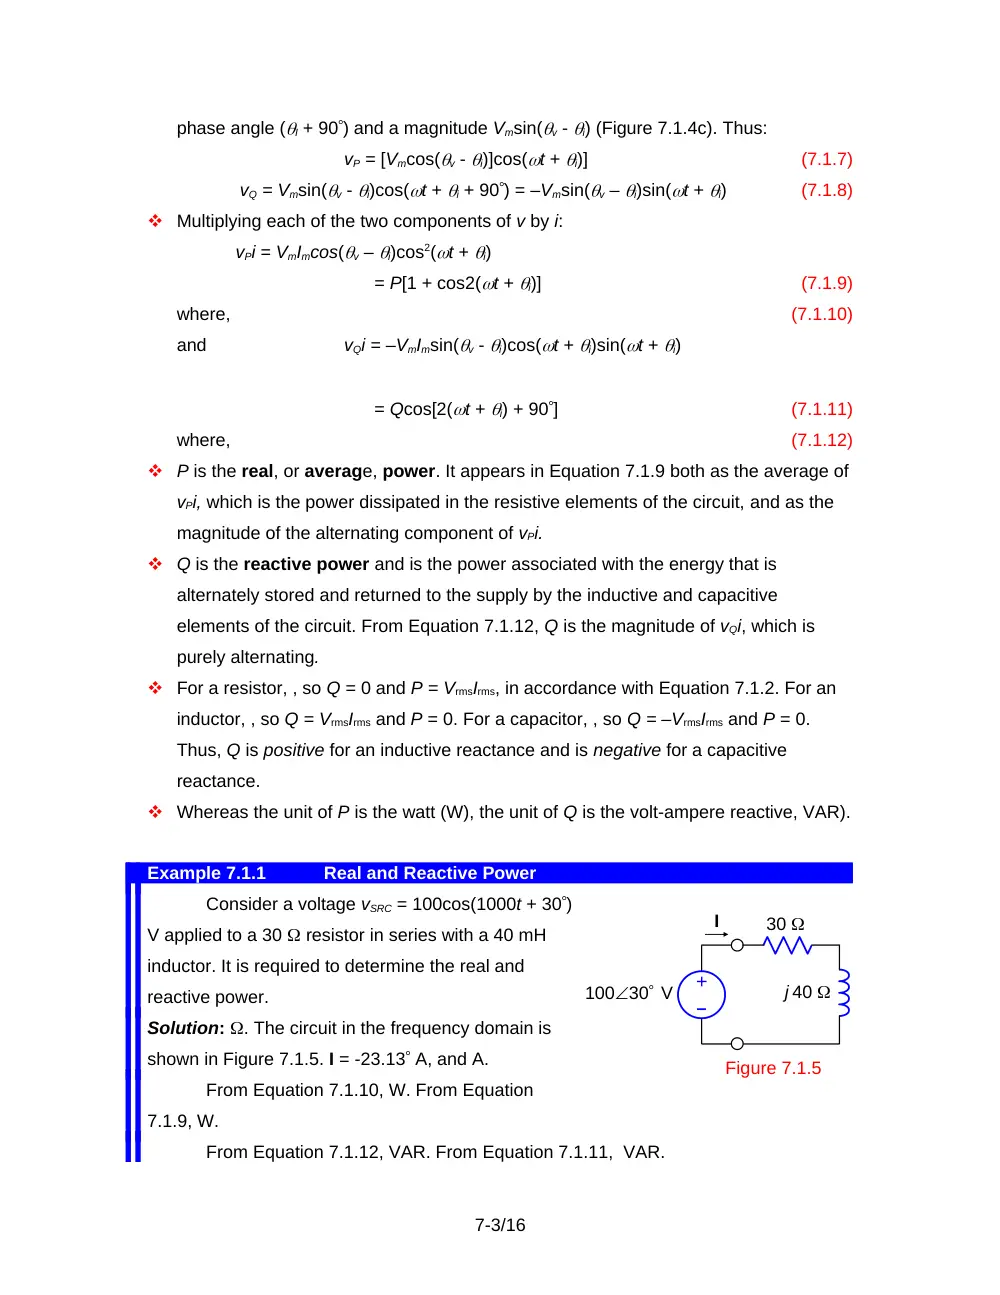
Consider a voltage vSRC = 100cos(1000t + 30)
V applied to a 30 resistor in series with a 40 mH
inductor. It is required to determine the real and
reactive power.
Solution: . The circuit in the frequency domain is
shown in Figure 7.1.5. I = -23.13 A, and A.
From Equation 7.1.10, W. From Equation
7.1.9, W.
From Equation 7.1.12, VAR. From Equation 7.1.11, VAR.
7-3/16
I
–
+
Figure 7.1.5
30
j 40
10030 V
P is the average power dissipated in the resistor, which is also = W. The
maximum instantaneous power dissipation is 2P = 120 W and occurs when . The energy
stored in the inductor at any instant is . The rate at which this energy is stored is = ,
which is the same as Equation 7.1.11, where VAR.
7.2
Complex Power
Complex Power Triangle
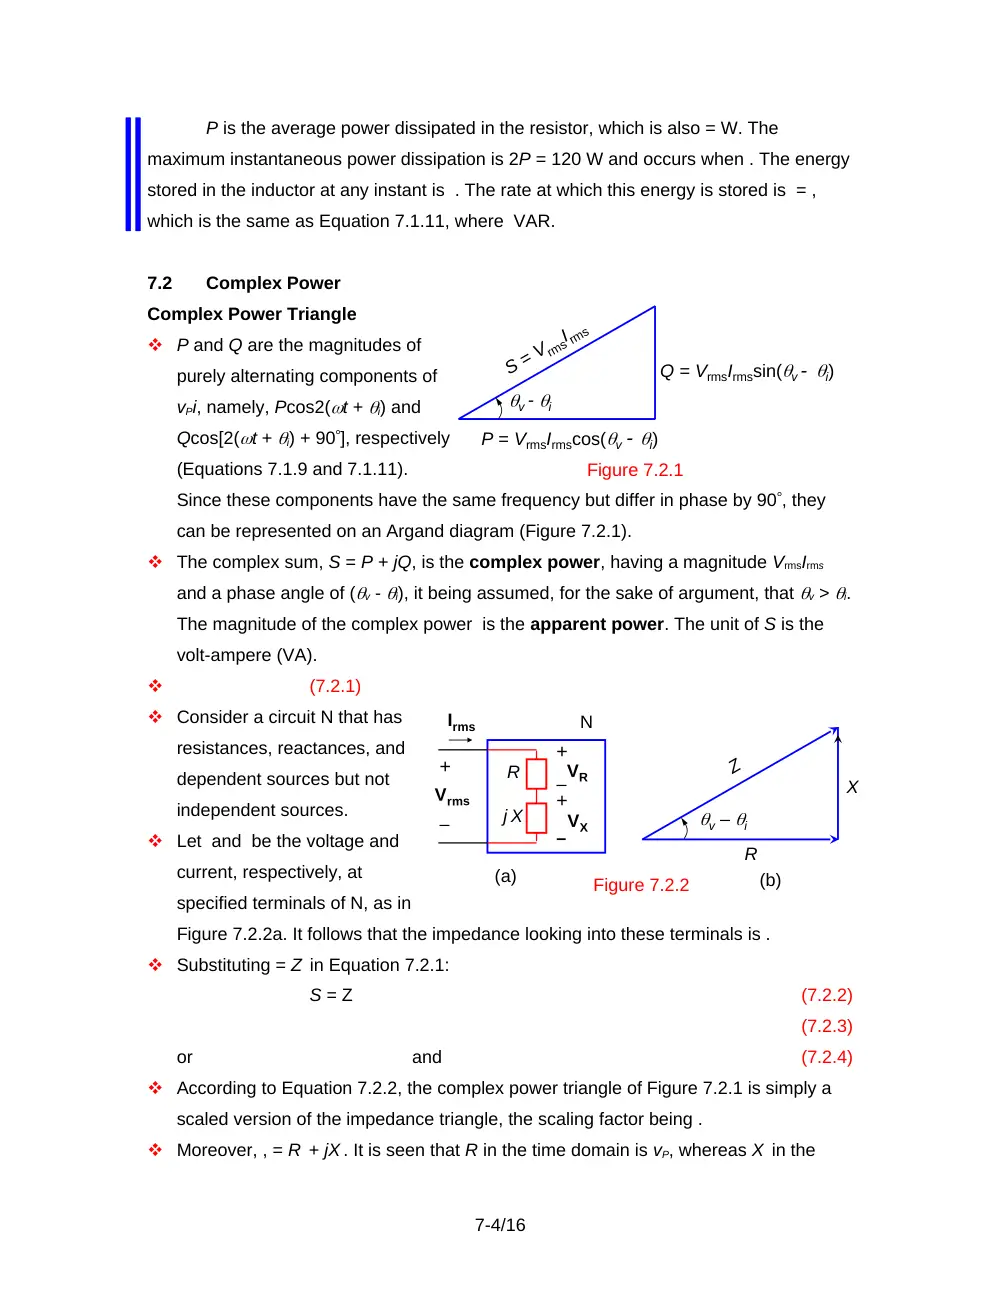
P and Q are the magnitudes of
purely alternating components of
vPi, namely, Pcos2(t + i) and
Qcos[2(t + i) + 90], respectively
(Equations 7.1.9 and 7.1.11).
Since these components have the same frequency but differ in phase by 90, they
can be represented on an Argand diagram (Figure 7.2.1).
The complex sum, S = P + jQ, is the complex power, having a magnitude VrmsIrms
and a phase angle of (v - i), it being assumed, for the sake of argument, that v > i.
The magnitude of the complex power is the apparent power. The unit of S is the
volt-ampere (VA).
(7.2.1)
Consider a circuit N that has
resistances, reactances, and
dependent sources but not
independent sources.
Let and be the voltage and
current, respectively, at
specified terminals of N, as in
Figure 7.2.2a. It follows that the impedance looking into these terminals is .
Substituting = Z in Equation 7.2.1:
S = Z
(7.2.2)
(7.2.3)
or
and
(7.2.4)
According to Equation 7.2.2, the complex power triangle of Figure 7.2.1 is simply a
scaled version of the impedance triangle, the scaling factor being .
Moreover, , = R + jX . It is seen that R in the time domain is vP, whereas X in the
7-4/16
Figure 7.2.1
P = VrmsIrmscos(v i)
Q = VrmsIrmssin(v i)
S = VrmsIrms
v - i
(a)
(b)
Figure 7.2.2
–
+
Irms
Vrms
N
R
j X
+
+
–
–VR
VX
Z
X
R
v – i
time domain is vQ.
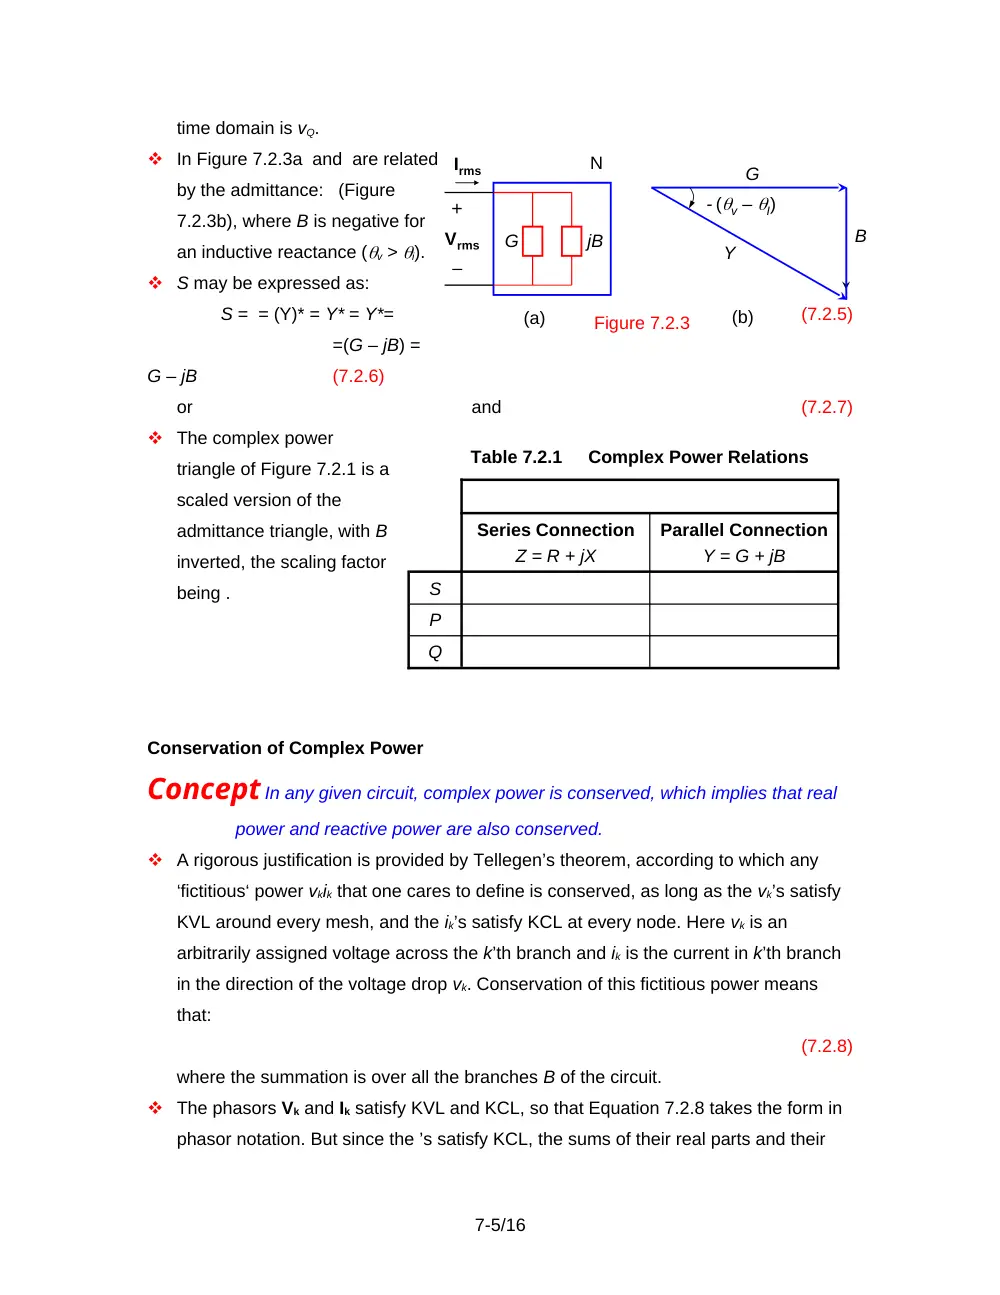
In Figure 7.2.3a and are related
by the admittance: (Figure
7.2.3b), where B is negative for
an inductive reactance (v > i).
S may be expressed as:
S = = (Y)* = Y* = Y*=
(7.2.5)
=(G – jB) =
G – jB
(7.2.6)
or
and
(7.2.7)
The complex power
triangle of Figure 7.2.1 is a
scaled version of the
admittance triangle, with B
inverted, the scaling factor
being .
Conservation of Complex Power
Concept In any given circuit, complex power is conserved, which implies that real
power and reactive power are also conserved.
A rigorous justification is provided by Tellegen’s theorem, according to which any
‘fictitious‘ power vkik that one cares to define is conserved, as long as the vk’s satisfy
KVL around every mesh, and the ik’s satisfy KCL at every node. Here vk is an
arbitrarily assigned voltage across the k’th branch and ik is the current in k’th branch
in the direction of the voltage drop vk. Conservation of this fictitious power means
that:
(7.2.8)
where the summation is over all the branches B of the circuit.
The phasors Vk and Ik satisfy KVL and KCL, so that Equation 7.2.8 takes the form in
phasor notation. But since the ’s satisfy KCL, the sums of their real parts and their
7-5/16
–
+
Vrms
B
(a)
Irms
N
G
jB
G
(b)
Y
- (v – I)
Figure 7.2.3
Table 7.2.1
Complex Power Relations
Series Connection
Z = R + jX
Parallel Connection
Y = G + jB
S
P
Q
imaginary parts are each separately equal to zero. It follows that the ’s also satisfy
KCL. Hence:
(7.2.9)
Equation 7.2.9 is an expression of the conservation of complex power. Moreover,
since Sk = Pk + jQk, it follows that Pk and Qk must each sum to zero:
and
(7.2.10)
In making these summations, real power is considered positive if dissipated and
negative if delivered. Inductive power is considered positive if absorbed and negative
if delivered. Conversely, capacitive power is considered negative if absorbed and
positive if delivered.
Concept Real power and reactive power can each be summed branch by branch in
a given circuit, with the total sum of each, over all branches of the circuit,
equal to zero.
Example 7.2.1
Application of Complex Power
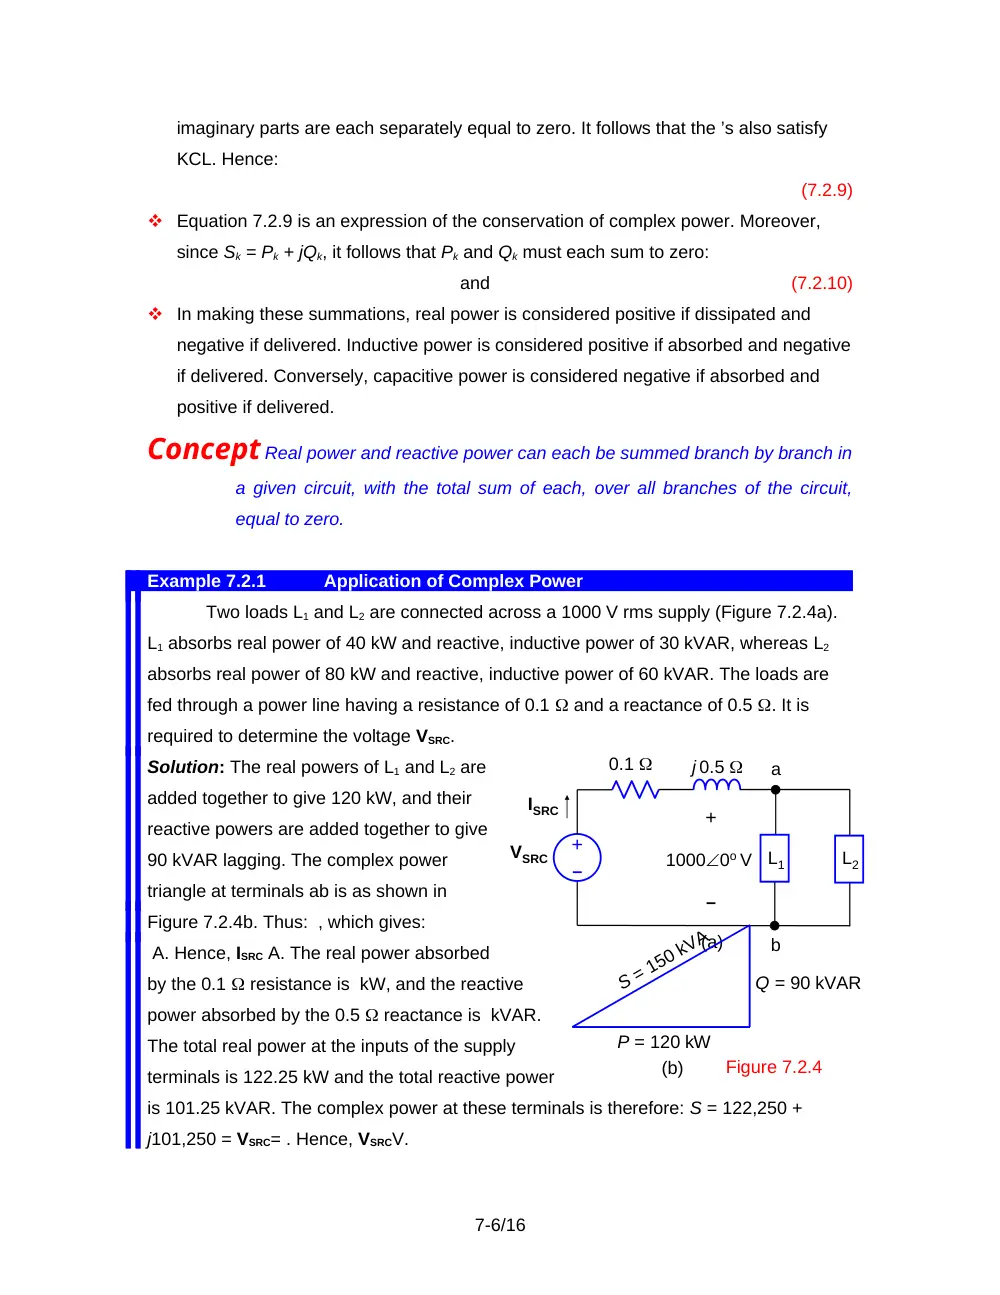
Two loads L1 and L2 are connected across a 1000 V rms supply (Figure 7.2.4a).
L1 absorbs real power of 40 kW and reactive, inductive power of 30 kVAR, whereas L2
absorbs real power of 80 kW and reactive, inductive power of 60 kVAR. The loads are
fed through a power line having a resistance of 0.1 and a reactance of 0.5 . It is
required to determine the voltage VSRC.
Solution: The real powers of L1 and L2 are
added together to give 120 kW, and their
reactive powers are added together to give
90 kVAR lagging. The complex power
triangle at terminals ab is as shown in
Figure 7.2.4b. Thus: , which gives:
A. Hence, ISRC A. The real power absorbed
by the 0.1 resistance is kW, and the reactive
power absorbed by the 0.5 reactance is kVAR.
The total real power at the inputs of the supply
terminals is 122.25 kW and the total reactive power
is 101.25 kVAR. The complex power at these terminals is therefore: S = 122,250 +
j101,250 = VSRC= . Hence, VSRCV.
7-6/16
(a)
j 0.5
VSRC
b
0.1
a
+
–
10000o V
ISRC
–
+
L1
L2
Figure 7.2.4
(b)
S = 150 kVA
P = 120 kW
Q = 90 kVAR
The real power delivered by the source is 122.25 kW. It is the sum of the real
power dissipated in the line resistance and in loads L1 and L2. The reactive power
delivered by the source is 101.25 kVAR. It is also the sum of the inductive reactive
power in the line reactance and in the two loads. Real and reactive power are conserved
in the system as a whole.
7.3
Power Factor Correction
Concept Reactive power, although it averages to zero over a cycle, generally
increases the voltage and current requirements of a load.
In Figure 7.2.2a, the real power delivered to the load is . To deliver a given Irms in the
presence of the reactance X requires a larger voltage across the series combination,
and therefore a higher degree of insulation of the conductors subjected to the higher
voltage.
Similarly, in Figure 7.2.3a, the real power delivered to the load is . To apply a given
Vrms in the presence of the susceptance B requires a larger current through the
parallel combination, and therefore a greater current-carrying capacity of the supply
conductors.
The relative value of the reactive component of a load is indicated by the phase
angle (v – i); cos(v – i) is the power factor (abbreviated p.f.), and sin(v – i) is
the reactive factor. For a purely resistive load, the p.f. is unity.
Since the p.f. is the same for a positive (v – i) as for a negative (v – i), these two
cases are distinguished by adding the attribute ‘lagging’ or ‘leading’, respectively. For
example, for a purely inductive load, v – i = 90, and the p.f. is zero lagging,
whereas for a purely capacitive load, v – i = –90, and the p.f. is zero leading.
A low p.f. is undesirable because of the additional current and voltage burdens
placed on the supply. In the case of large loads, the additional costs involved can be
quite considerable, so that some measures are taken to improve the power factor.
This power factor correction is achieved by adding capacitive reactance to
counteract the inductive reactance of the load.
Example 7.3.1
Power Factor Correction
Assuming the supply frequency is 50 Hz, determine the capacitance that must be
added in parallel with the loads of Figure 7.2.4 of Example 7.2.1 so as to make the p.f.
7-7/16
unity at terminals ab. What is the effect of this capacitance on the supply current and
voltage?
Solution: The reactive power at terminals ab was found in Example 7.2.1 to be 90
kVAR. The reactive power of the added capacitor must be –90 kVAR. The value of
capacitance follows from the fact 2fCV2 = – Q (Equation 7.2.6). Thus, , or C = 286.5 F.
The total reactive power at terminals ab is now zero. Hence, S = 120,000 =
. This gives: = 1200 A. The real power absorbed by the 0.1 resistance is kW, and the
reactive power absorbed by the 0.5 reactance is kVAR. The total real power at the
inputs of the supply terminals is 121.44 kW and the total reactive power is 7.2 kVAR.
The complex power at these terminals is therefore: VSRC . Hence, VSRC V.
The p.f. at the load was initially = 0.8. By correcting it to 1 the supply current was
reduced from 150 A to 120 A and the supply voltage was reduced by a relatively small
amount in this case, from 1058 to 1014 V rms, due to the reduced voltage drop across
the line impedance.
7.4
Maximum Power Transfer
A matter of practical importance is to transfer maximum power to a load from a given
source of specified open-circuit voltage and source impedance.
Purely Resistive Circuit
In Figure 7.4.1, , and the power transferred to
is:
(7.4.1)
With VSRC and Rsrc constant, we wish to find the
value of that maximizes If we derive and set it
to zero, we find that is maximum for given by:
(7.4.2)
When Equation 7.4.2 is satisfied, the source and load resistances are matched.
The voltage across is , and the power transferred to the load is
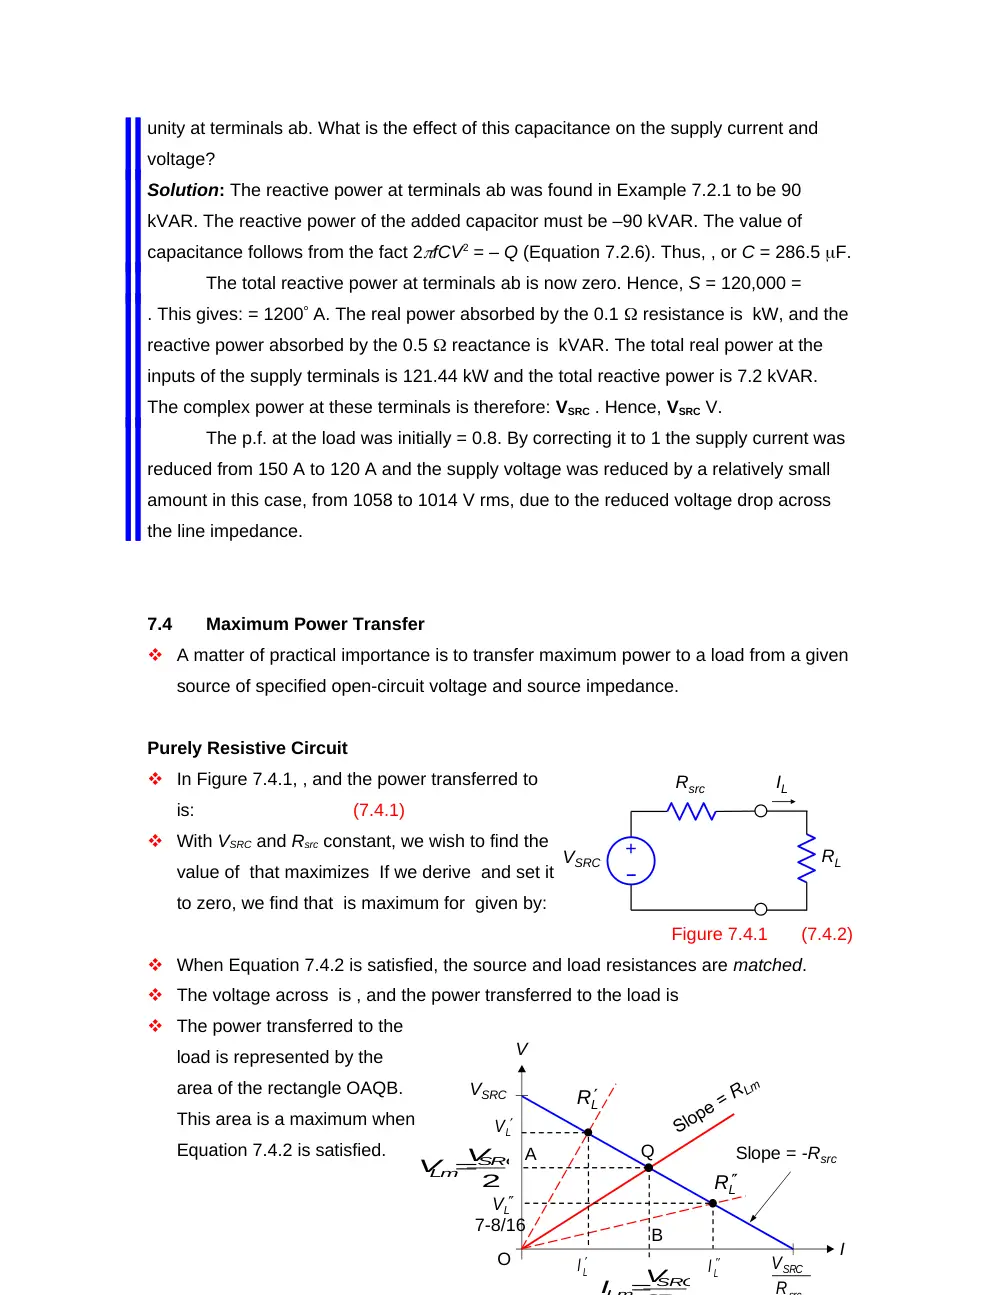
The power transferred to the
load is represented by the
area of the rectangle OAQB.
This area is a maximum when
Equation 7.4.2 is satisfied.
7-8/16
Rsrc
RL
VSRC
IL
–
+
Figure 7.4.1
V
VSRC
Q
O
Slope = -Rsrc
I
L
V
LI
L
V
L
R
L
R
2
SRC
Lm V
V
src
SRC
R
V
SRC
ILm V
A
B
LI
Figure 7.4.3
V
VSRC
Q
O
I
2
SRC
Lm V
V
src
SRC
R
V
src
SRC
Lm
R
V
I
2
A
B
C
D
E
F
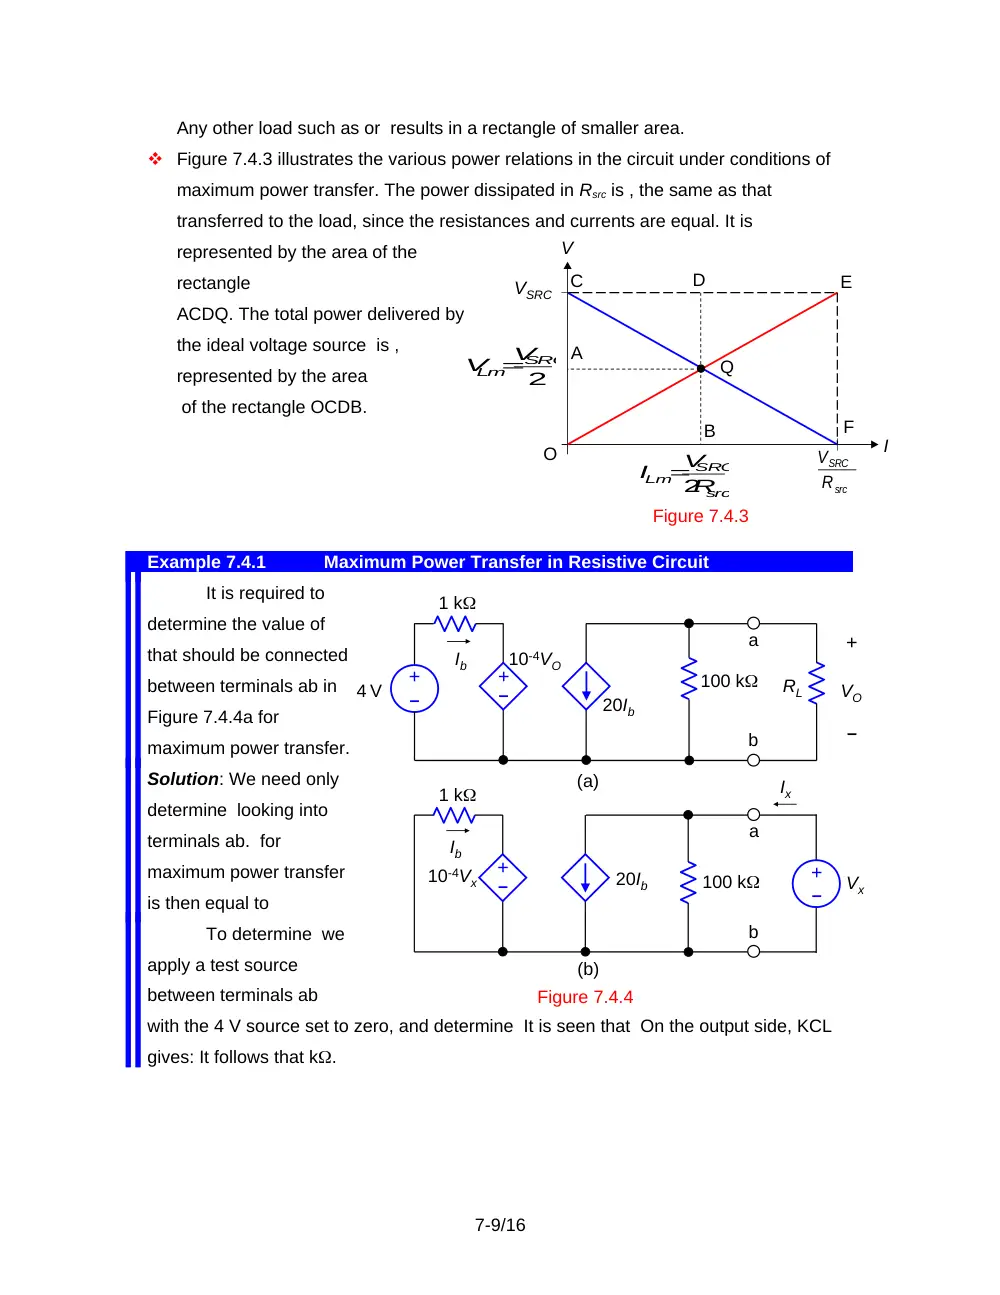
Any other load such as or results in a rectangle of smaller area.
Figure 7.4.3 illustrates the various power relations in the circuit under conditions of
maximum power transfer. The power dissipated in Rsrc is , the same as that
transferred to the load, since the resistances and currents are equal. It is
represented by the area of the
rectangle
ACDQ. The total power delivered by
the ideal voltage source is ,
represented by the area
of the rectangle OCDB.
Example 7.4.1
Maximum Power Transfer in Resistive Circuit
It is required to
determine the value of
that should be connected
between terminals ab in
Figure 7.4.4a for
maximum power transfer.
Solution: We need only
determine looking into
terminals ab. for
maximum power transfer
is then equal to
To determine we
apply a test source
between terminals ab
with the 4 V source set to zero, and determine It is seen that On the output side, KCL
gives: It follows that k.
7-9/16
4 V
–
+
20Ib
10-4VO
1 k
+
–
VO
a
b
100 k
(a)
Figure 7.4.4
Ib
+
–
RL
(b)
20Ib
10-4Vx
1 k
+
–
Vx
a
b
100 k
Ib
+
–
Ix
Source and Load Impedances
Let VSRC and Zsrc = Rsrc + jXsrc represent, in general, the TEC as seen from terminals
ab of a given circuit connected to a load ZL = RL +jXL. The current phasor IL is given
by:
ILVSRC
(7.4.5)
Assuming that IL is expressed in terms of its rms value, the power transferred to RL
is:
(7.4.6)
If RL and XL can be varied independently, it is clear that, with RL fixed, PL is maximum
for XL given by:
XLm = –Xsrc
(7.4.7)
With this condition satisfied, Equation 7.4.6 reduces to Equation 7.4.1. PL is
maximum when Equation 7.4.2 is satisfied, that is, RLm = Rsrc.
Combining this condition with that of Equation 7.4.7, gives the condition for maximum
power transfer as:
(7.4.8)
where is the conjugate of Zsrc.
If RL and XL can be varied independently, but their range of variation is restricted, it is
clear from Equation 7.4.6 that under these conditions, with RL fixed, PL is maximum
when (Xsrc + XL) is as small as possible. With (Xsrc + XL) considered constant, the
condition for maximum power transfer can be determined by deriving from Equation
7.4.6 and setting it to zero. This gives:
(7.4.9)
If RL cannot be made equal to this value, then a value of RL as close to it as possible
will give maximum power transfer.
Another case of interest arises from the use of a transformer with ZL. The load
impedance reflected to the primary side is ideally , where Np and Ns are the number
of turns of the
primary and secondary windings, respectively. It follows that . The effect of an ideal
transformer is to vary while the phase angle remains constant.
To derive the condition for maximum power transfer under these conditions, we
substitute in Equation 7.4.6 , , , and to obtain:
(7.4.10)
7-10/16
Figure 7.4.9
j 2
1:5
1400 V
rms
jXL
b
2
6
a
RL
–
+
where the only
variable on the
RHS is .
Deriving and
setting it equal to
zero gives for the
condition of
maximum power
transfer:
(7.4.11)
Example 7.4.2
Maximum Power Transfer with Variable Load Impedance
Given the circuit of
Figure 7.4.9, it is required to
determine the condition for
maximum power transfer,
and the power transferred to
RL, under the following
conditions:
(a) Both RL and XL are variable independently.
(b) RL is fixed at 35 and XL is variable.
(c) XL is fixed at –50 and RL is variable.
(d) RL is fixed at 35 , XL is fixed at –50 , and the transformer can be selected to have
any desired ratio.
Solution: The first step is to derive TEC looking into terminals ab towards the source,
and reflect TEC to the secondary side.
When terminals ab are open-circuited, V rms. With the source set to zero, the
impedance looking into terminals ab is ZTh = 6 + 7 + j . Reflecting TEC to the secondary
side, it becomes a voltage source of 70(1 + j)5 = 350(1 + j) V rms in series with (7 +
j)25 = 175 + j25 (Figure
7.4.10).
7-11/16
45
2
350
V
jX L
175
RL
j 25
–
+
Figure 7.4.10
rms
Table 7.4.1 Conditions for Maximum Power Transfer
Allowed Variation
Condition for Maximum
Power Transfer
RL and XL can be varied
independently over an
arbitrary range
RLm = Rsrc and XLm = -Xsrc
RL is fixed but XL can be varied
XLm = -Xsrc
XL is fixed but RL can be varied
RL and XL can be varied
independently over a
restricted range
XLm as close to -Xsrc as
possible, RLm as close to
as
possible.
can be varied, while L
is constant
(a) If both RL and XL can be varied independently, the condition for maximum power
transfer is given by Equation 7.4.8: RLm = 175 and XLm = –25 . The power transferred
to RLm is W.
(b) If RL = 35 and XL is variable, maximum power transfer occurs when XLm = –25 as in
(a). The power transferred to RL is W.
(c) If XL = – 50 and RL is variable, the condition for maximum power transfer is given
by Equation 7.4.9: = 176.8 . The magnitude of the current is A rms, and the power
transferred to RLm is W.
(d) If RL is fixed at 35 and XL is fixed at -50 , 61.0 . The magnitude of ZTh is . The
turns ratio, instead of 1:5 should be , or 1:2.94, which is nearly 1:3. TEC reflected to the
secondary side will be a source of
magnitude V rms in series with a resistance of and a reactance of . The magnitude
of the current is 2.8 A rms, and the power transferred to RL is W.
Admittance Relations
Let ISRC and Ysrc represent, in general, NEC as seen from terminals ab of a given
circuit connected to a load YL = GL + jBL. The corresponding relations to Equations
7.4.8, 7.4.9, and 7.4.11 are, respectively:
(7.4.12)
(7.4.13)
(7.4.14)
Example 7.4.3
Admittance Power Relations
Given the circuit of Figure 7.4.12. It is required to determine the condition for
maximum power transfer,
and the power transferred to
RL, assuming that:
(a) Both RL and X are
variable independently.
(b) Both RL and X are
variable independently
7-12/16
Figure 7.4.12
–
+
10
j 10
30 0o V
Rsrc
j Xsrc
j 20
j X
RL
but only over the magnitude range 30 to 50 each.
(c) If RL is fixed at 30 and X is variable, what is the condition for minimum power
dissipated in Rsrc and how much is this power?
Solution: (a) Let us convert the source and its impedance to its NEC. The Norton
source current is: A rms. The Norton admittance is: S. The circuit becomes as shown
in Figure 7.4.13.
According to
Equation 7.4.12,
maximum power is
transferred to the load
when Bm = -BN and GLm = GN. The first condition gives: , from which: Xm = -10 . The
second condition gives: , or RL = 20 . Under these conditions, the current in GL is , and
the power transferred to GL is W.
(b) If X is variable between -30 and -50 , B is variable between and S. Maximum
power transfer occurs when B has its largest positive value, which is . Under these
conditions the total susceptance is . GLm for maximum power transfer is then given by
Equation 7.4.13 as: S. The value of GL nearest to this is S. Maximum power is
transferred under these conditions when RL and X have a magnitude of 30 each.
To find the maximum
power transferred, we note
that the circuit reduces under
these conditions to that
shown in Figure 7.4.14. The
admittance Yx of the
combination is
. The voltage VxIN, so, |Vx||IN| and the power transferred to GL is: GL|Vx|2 W.
(c) If RL is fixed and X is variable, minimum power is dissipated in Rsrc when the current
in this resistor is a minimum. With the source reactance fixed, the current in Rsrc is a
minimum when the impedance of the parallel combination of the load in Figure 7.4.12 is
a maximum, that is, when the admittance YL is a minimum. , or S. With X the only
variable in this relation, is a minimum
when the second bracketed term,
vanishes, that is when X = -20. The circuit
7-13/16
+
–
Vx
S
30
1
A
245
5
.
1
o
S
20
1
A
15
j
Figure 7.4.14
30
–
+
10
j 10
I
300o V
Figure 7.4.15
GL
X
j
S
20
j
S
20
1
A
245
5
.
1
o
S
20
j
Figure 7.4.13
reduces to that of Figure 7.4.15. The current I, and |I| A. The power dissipated in Rsrc is
Rsrc|I|2 W.
7.5
Measurement of Current, Voltage, and Power
The older measuring instruments are analog, the deflection of the indicating pointer
being proportional (or analogous) to the current passing through the instrument.
Modern instruments are digital; the quantity to be measured is sampled, digitized,
and displayed as numerical digits.
Compared to analog instruments, digital instruments are more accurate, generally
have negligible loading effects, can measure very low values of current or voltage,
and can change ranges automatically. Nevertheless, analog instruments are useful
for quick monitoring of the quantity being measured and for quick verification of
normal or safe levels.
A basic type of analog movement, the moving coil or D’Arsonval movement,
consists essentially of a current-carrying coil that is free to rotate in the magnetic field
of a permanent magnet (Figure 7.5.1). A pointer attached to the coil can move
relative to a calibrated scale.
With proper design, the angle of rotation is
directly proportional to the coil current, resulting
in
a linear scale.
In order to measure the current passing through
a
given circuit element, an ammeter is connected
in
series with the element (Figure 7.5.2).
An ideal ammeter has zero impedance, so that
it
does not introduce additional impedance in
series with Z, which would affect the current
being measured. For example, if the circuit in
Figure 7.5.2 has a TEC between terminals ab
of 50 V in series with a 25 resistance and
that Z also equals 25 . The current in the
circuit is then 1 A. If an ammeter of 1
resistance is used to measure the current,
the total resistance in the circuit becomes 51
, and the ammeter reading will be A, which is in error by nearly -2%.
7-14/16
Circuit
Z
A
a
b
Figure 7.5.2
N
S
Figure 7.5.1
Calibrated scale
Current-carrying coil
0
10
In order to measure the voltage across a
given circuit element, a voltmeter is
connected in parallel with the element,
(Figure 7.5.3).
An ideal voltmeter should have infinite
impedance, so that it does not introduce
additional impedance in parallel with Z, which
would affect the voltage being measured. For example, if we assume that the circuit
in Figure 7.5.3 has an NEC between terminals ab of 1A in parallel with a 50
resistance and that Z also equals 50 . It follows that Vab = 25 V. If a voltmeter of 2.5
k is used to measure the voltage, the total resistance becomes 25||2,500 = 24.75
. The voltmeter reading will be 24.75 V, which is in error by nearly -1%.
Concept For accurate current and voltage measurements, the impedance of an
ammeter should be small compared with the impedance that appears in
series with it, and the impedance of a voltmeter should be large compared
with the impedance that appears in parallel with it.
Power Measurements
Since , the apparent power |S| at any location is determined by measuring and at
that location by means of an ac voltmeter and an ac ammeter, respectively.
To measure the real
power, a wattmeter is
used. The wattmeter has
two coils, a current coil and
a
voltage coil with polarity
markings. The current coil
is
connected like an ammeter
so that the load current
flows through it. The
voltage coil is connected
across the load terminals,
like a voltmeter.
7-15/16
Circuit
Z
V
Figure 7.5.3
a
b
Current coil
Load
+
–
V
I
+
+
–
–
Voltage coil
Figure 7.5.4
When the polarities of the two coils with respect to I and V are as indicated in Figure
7.5.4, the wattmeter reads the power absorbed, . If the polarity of either coil is
reversed, the wattmeter gives a negative indication.
Knowing P and , Q and the p.f. readily follow from the complex power triangle.
7-16/16