
EECE 491 Lecture 7, Spring 2016
American University of Beirut · Discrete-time Signal Processing · 73 pages


Showing the first 10 of 73 pages. Download the PDF to see all of it.
More EECE 491 files
Show the text of this lab
Prof. M. Mansour
EECE 491: Discrete‐time Signal Processing
1
EECE 491: Discrete‐time Signal Processing
Mohammad M. Mansour
Dept. of Electrical and Compute Engineering
American University of Beirut
Lecture 7: Digital Filters
Part II: FIR Filter Design
Prof. M. Mansour
EECE 491: Discrete‐time Signal Processing
2
Announcements
Reading
–
Chapter 10, Proakis
–
Chapter 7, O&S
Prof. M. Mansour
EECE 491: Discrete‐time Signal Processing
3
Outline
Causality and Implications
Characteristics of practical filters
Linear‐phase FIR filter types
Design of linear‐phase FIR filters using Windowing technique
Design of optimum equiripple linear‐phase FIR Filters
–
Alternation theorem
–
Parks‐McClellan algorithm
Prof. M. Mansour
EECE 491: Discrete‐time Signal Processing
4
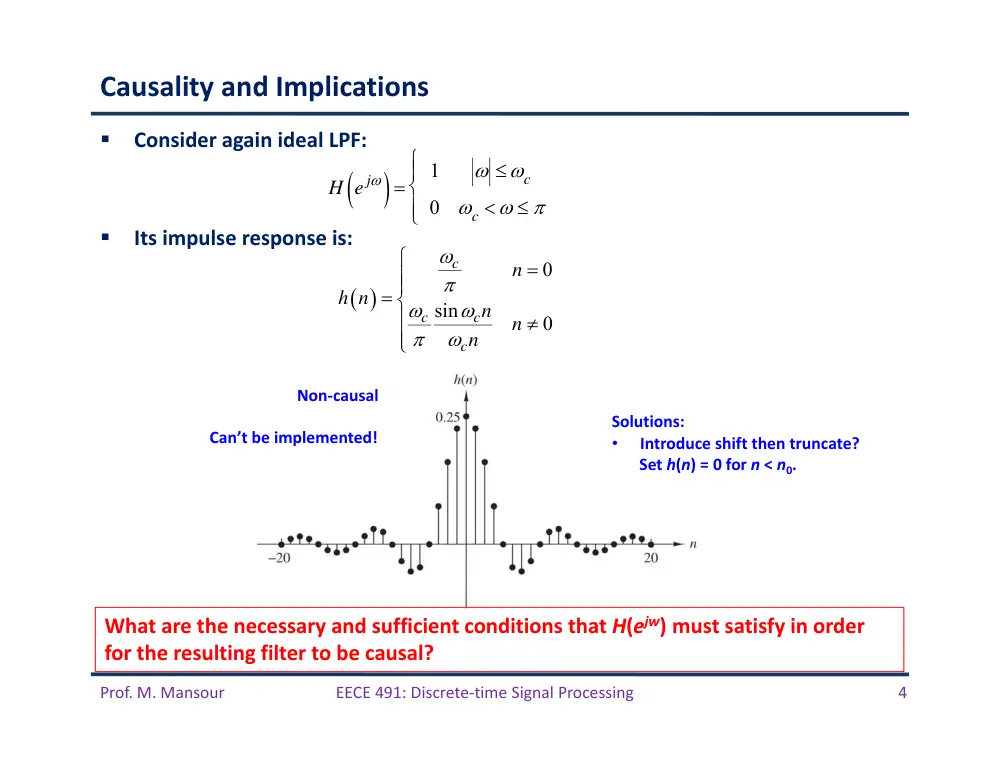
Causality and Implications
Consider again ideal LPF:
Its impulse response is:
H e j
1
c
0
c
0
sin
0
c
c
c
c
n
h n
n
n
n
Non‐causal
Can’t be implemented!
Solutions:
•
Introduce shift then truncate?
Set h(n) = 0 for n < n0.
What are the necessary and sufficient conditions that H(ejw) must satisfy in order
for the resulting filter to be causal?
Prof. M. Mansour
EECE 491: Discrete‐time Signal Processing
5
Paley‐Wiener Theorem
Theorem: If h(n) has finite energy and h(n) = 0 for n < 0, then
Conversely, if H(ejw) is square‐integrable and if the above integral is finite, then
we can associate with a phase response so that the resulting filter
with response
is causal.
Implications:
–
can be zero at some frequencies but not over a finite band of frequencies
–
Hence, any ideal filter (containing flat regions) is not causal
Causality imposes tight constraints on an LTI system
Causality also implies a strong relationship between
–
Real and imaginary
components of
–
Magnitude and phase
of
–
Both pairs of quantities cannot be specified independently for a causal filter
ln H e j
d
H e j
H e j
e j
H e j
H e j
HR e j
HI e j
H e j
H e j
e j
H e j
Prof. M. Mansour
EECE 491: Discrete‐time Signal Processing
6
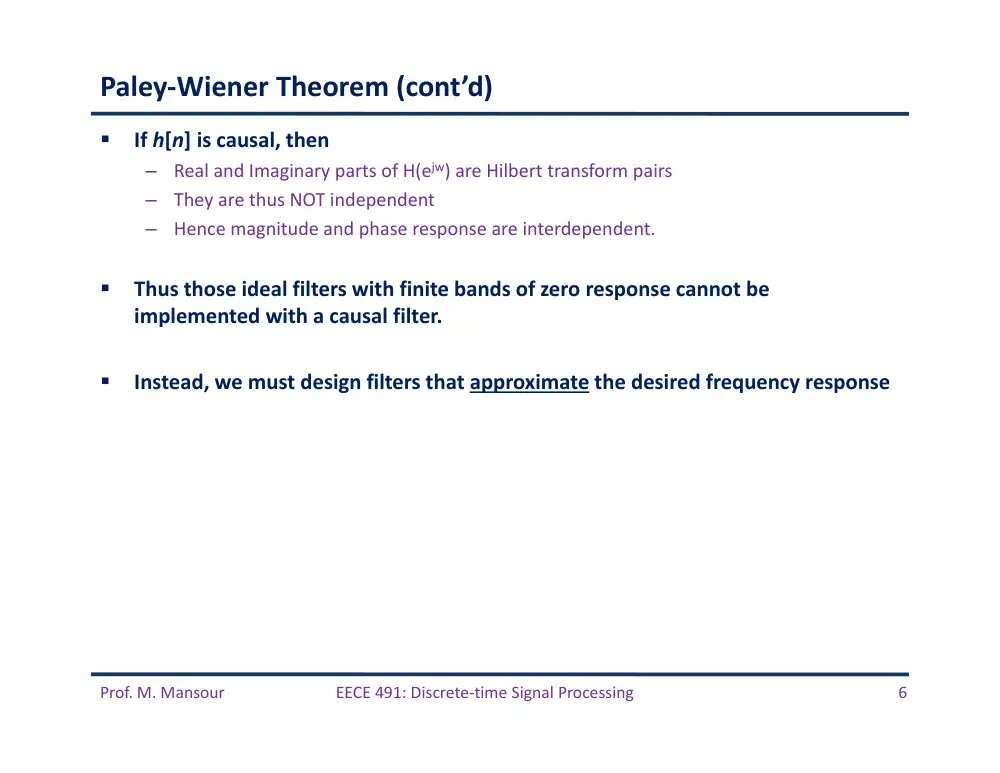
Paley‐Wiener Theorem (cont’d)
If h[n] is causal, then
–
Real and Imaginary parts of H(ejw) are Hilbert transform pairs
–
They are thus NOT independent
–
Hence magnitude and phase response are interdependent.
Thus those ideal filters with finite bands of zero response cannot be
implemented with a causal filter.
Instead, we must design filters that approximate the desired frequency response
Prof. M. Mansour
EECE 491: Discrete‐time Signal Processing
7
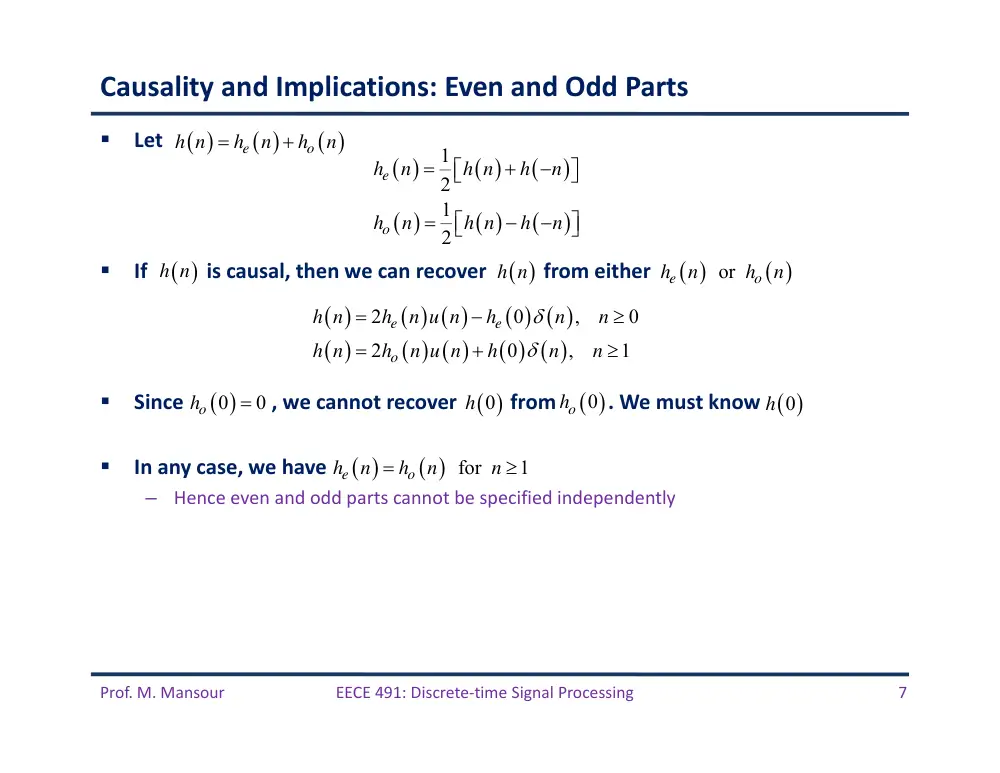
Causality and Implications: Even and Odd Parts
Let
If
is causal, then we can recover
from either
Since , we cannot recover
from . We must know
In any case, we have
–
Hence even and odd parts cannot be specified independently
e
o
h n
h
n
h
n
1
2
1
2
e
o
h
n
h n
h
n
h
n
h n
h
n
2
0
,
0
2
0
,
1
e
e
o
h n
h
n u n
h
n
n
h n
h
n u n
h
n
n
h n
h n
or
e
o
h
n
h
n
0
0
ho
h 0
ho 0
0
h
for
1
e
o
h
n
h
n
n
Prof. M. Mansour
EECE 491: Discrete‐time Signal Processing
8
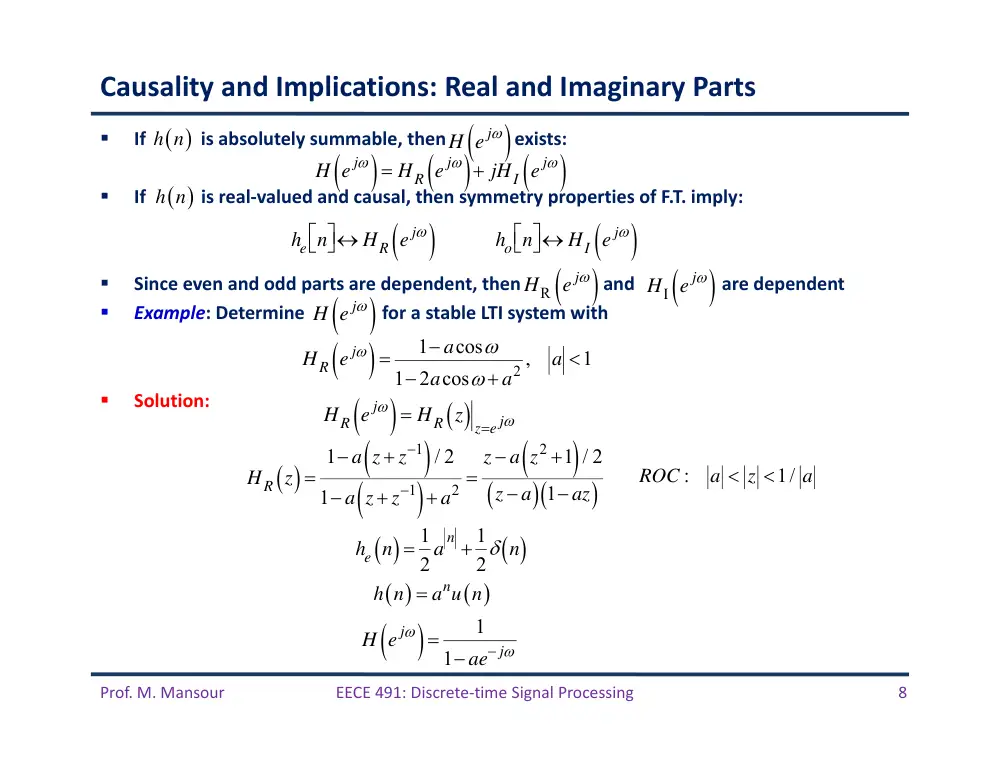
Causality and Implications: Real and Imaginary Parts
If is absolutely summable, then exists:
If
is real‐valued and causal, then symmetry properties of F.T. imply:
Since even and odd parts are dependent, then and are dependent
Example: Determine for a stable LTI system with
Solution:
H e j
HR e j
jHI e j
he n
HR e j
ho n
HI e j
HR e j
1 acos
12acos a2 ,
a 1
HR e j
HR z ze j
HR z
1 a z z1
/ 2
1 a z z1
a2
z a z2 1
/ 2
z a
1 az
:
1/
ROC
a
z
a
he n 1
2 a
n 1
2 n
n
h n
a u n
H e j
1
1 ae j
h n
h n
H e j
HI e j
HR e j
H e j
Prof. M. Mansour
EECE 491: Discrete‐time Signal Processing
9
Solution (cont’d)
z a z2 1
/ 2
z a
1 az
az2 2z a
2 az2 a2 1
z a
az2 2z a a2 1
z a2 1
z
2 az2 a2 1
z a
1
2
1 a2
z
2 z a
1 az
1
2 a / 2
z a 1/ 2
1 az
1
2
1/ 2
1 z / a 1/ 2
1 az
he n
1
2 n
1
2
1
a
n
u n1
1
2 anu n
1
2 n
1
2 anu n1
1
2 anu n
1
2 n
1
2 a
n
a 1
ROC :
a z 1/ a
1
n
n
x n
u n
b u
n
1
1
1
1
1
1
X z
z
bz
ROC
z :
z
b
Prof. M. Mansour
EECE 491: Discrete‐time Signal Processing
10
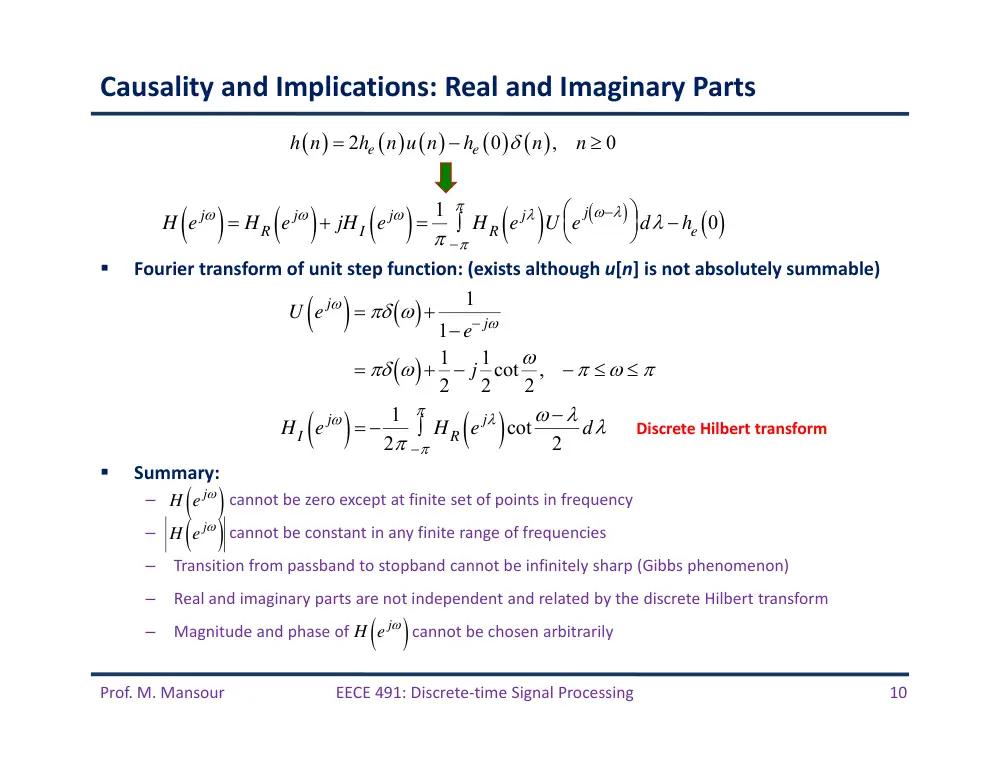
Causality and Implications: Real and Imaginary Parts
Fourier transform of unit step function: (exists although u[n] is not absolutely summable)
Summary:
–
cannot be zero except at finite set of points in frequency
–
cannot be constant in any finite range of frequencies
–
Transition from passband to stopband cannot be infinitely sharp (Gibbs phenomenon)
–
Real and imaginary parts are not independent and related by the discrete Hilbert transform
–
Magnitude and phase of
cannot be chosen arbitrarily
2
0
,
0
e
e
h n
h
n u n
h
n
n
H e j
HR e j
jHI e j
1
HR e j
U e j
d he 0
U e j
1
1 e j
1
2 j 1
2cot
2 ,
HI e j
1
2
HR e j
cot
2
d
Discrete Hilbert transform
H e j
H e j
H e j
Prof. M. Mansour
EECE 491: Discrete‐time Signal Processing
11
Characteristics of Practical Frequency‐Selective Filters
Prof. M. Mansour
EECE 491: Discrete‐time Signal Processing
12
Linear‐Phase FIR Filter Types
Prof. M. Mansour
EECE 491: Discrete‐time Signal Processing
13
Design of FIR Filters
1
0
M
k
y n
h k x n
k
1
0
M
k
k
H z
h k z
2
1
1
2
0
1
2
2
1
M
M
H z
h
h
z
h
z
h M
z
h M
z
3 /2
1 /2
1 2
/2
1 2
/2
0
/2 1
1 /2
1 2
/2
1 2
/2
0
1
,
odd
2
,
even
M
M
M
k
M
k
n
M
M
M
k
M
k
n
M
z
h
h n
z
z
M
H z
z
h n
z
z
M
Symmetry conditions:
Also:
1
0
M
k
k
H z
h k z
1
1
1
1
1
1
1
0
0
0
1
M
M
M
M
M
k
M
k
k
k
k
k
z
H z
z
h k z
h k z
h M
k z
Linear Phase
1
1
M
z
H z
H z
Prof. M. Mansour
EECE 491: Discrete‐time Signal Processing
14
Symmetry of Zero Locations for a Linear‐Phase FIR Filter
roots of H(z) are identical to roots of H(z‐1)
–
Roots of H(z) must occur in reciprocal pairs: z1 root 1/z1 is also a root
–
If h(n) is real‐valued, then complex‐valued roots occur in complex‐conjugate pairs
1
1
M
z
H z
H z
Prof. M. Mansour
EECE 491: Discrete‐time Signal Processing
15
FIR Filter Types
Four types of FIR filters of length M:
–
Type 1: Symmetric
–
Type 2: Symmetric
–
Type 3: Anti‐Symmetric
–
Type 4: Anti‐Symmetric
3 /2
1 /2
1 2
/2
1 2
/2
0
/2 1
1 /2
1 2
/2
1 2
/2
0
1
,
odd
2
,
even
M
M
M
k
M
k
n
M
M
M
k
M
k
n
M
z
h
h n
z
z
M
H z
z
h n
z
z
M
1
and
even
h n
h M
n
M
1
and
odd
h n
h M
n
M
1
and
even
h n
h M
n
M
1
and
odd
h n
h M
n
M
Prof. M. Mansour
EECE 491: Discrete‐time Signal Processing
16
FIR Filter Types 1 and 2
is a real function of :
Phase:
1 /2
j
M
r
H
H
e
3 /2
0
/2 1
0
1
1
2
cos
,
odd
2
2
1
2
cos
,
even
2
M
n
r
M
n
M
M
h
h n
n
M
H
M
h n
n
M
1 / 2
if
0
1 / 2
if
0
r
r
M
H
M
H
1
h n
h M
n
Hr
Prof. M. Mansour
EECE 491: Discrete‐time Signal Processing
17
FIR Filter Types 3 and 4
Anti‐symmetric:
–
When M is odd, the center point is n = (M – 1)/2:
Hr(w) is a real function of w:
Phase:
1
h n
h M
n
1
0
2
h M
1 /2
/2
j
M
r
H
H
e
3 /2
0
/2 1
0
1
2
sin
,
odd
2
1
2
sin
,
even
2
M
n
r
M
n
M
h n
n
M
H
M
h n
n
M
1 / 2
if
0
2
3
1 / 2
if
0
2
r
r
M
H
M
H
Prof. M. Mansour
EECE 491: Discrete‐time Signal Processing
18
Choice of Filter Type
Symmetric:
–
M even: # filter coefficients that specify frequency response is (M+1)/2
–
M odd: # filter coefficients that specify frequency response is M/2
Anti‐Symmetric: h((M–1)/2)=0
–
M even: # filter coefficients that specify frequency response is (M – 1)/2
–
M odd: # filter coefficients that specify frequency response is M/2
Choice depends on application
–
Anti‐symmetric and M odd:
• Hence not suitable for a low‐pass nor high‐pass filter
–
Anti‐symmetric and M even:
• Hence not suitable for a low‐pass filter
–
Symmetric: FIR filter has non‐zero response at zero frequency
0
0
0
r
r
H
H
0
0
Hr
3 /2
0
/2 1
0
1
2
,
odd
2
0
2
,
even
M
n
r
M
n
h M
h n
M
H
h n
M
Prof. M. Mansour
EECE 491: Discrete‐time Signal Processing
19
FIR Filter Types: Examples
2 sin 5
/ 2
sin
/ 2
j
H
e
5 /2 sin 3
sin
/ 2
j
H
e
2sin
j
H
je
/2 2sin
/ 2
j
H
je
Prof. M. Mansour
EECE 491: Discrete‐time Signal Processing
20
Example 1
2 sin 5
/ 2
sin
/ 2
j
H
e
Magnitude response
Phase response
Group delay
Prof. M. Mansour
EECE 491: Discrete‐time Signal Processing
21
Example 2
5 /2 sin 3
sin
/ 2
j
H
e
Magnitude response
Phase response
Group delay
Prof. M. Mansour
EECE 491: Discrete‐time Signal Processing
22
Example 3
2sin
j
H
je
Magnitude response
Phase response
Group delay
Prof. M. Mansour
EECE 491: Discrete‐time Signal Processing
23
Example 4
Magnitude response
Phase response
Group delay
/2 2sin
/ 2
j
H
je
Prof. M. Mansour
EECE 491: Discrete‐time Signal Processing
24
Plots of Zeros of Linear‐Phase Systems
Typical plots of zeros for linear-phase systems. (a) Type I. (b) Type II. (c) Type III. (d) Type IV.
Prof. M. Mansour
EECE 491: Discrete‐time Signal Processing
25
Design of FIR Filters by Windowing
Prof. M. Mansour
EECE 491: Discrete‐time Signal Processing
26
Windowing Technique
Desired frequency response and impulse response:
–
Hd(w), hd(n)
From Hd(w), obtain hd(n)
–
hd(n) will have infinite duration
–
Truncate say at n = M – 1 to yield an FIR of length M.
Equivalent to multiplying by a window function w(n):
Resulting impulse response:
2
1
2
j n
d
d
n
j n
d
d
H
h
n e
h
n
H
e
d
w n
1
n 0,1,2,,M 1
0
otherwise
h n hd n w n
hd n
n 0,1,2,,M 1
0
otherwise
Prof. M. Mansour
EECE 491: Discrete‐time Signal Processing
27
Effect of Window Function on Desired Frequency Response
Fourier transform of w(n):
In frequency domain:
Convolution of Hd(w) and W(w) results in H(w) being a “smeared” version of Hd(w)
Note that if w(n)=1 for all n (no truncation), then W(w) is a periodic impulse train with
period 2� and hence Hd(w) = H(w)
Therefore, if w(n) is chosen to that W(w) is concentrated in a narrow band of frequencies
around w=0 (i.e. it approximates an impulse), then H(w) will “look like” Hd(w) except where
Hd(w) changes abruptly
1
1 /2
0
sin
/ 2
sin
/ 2
M
j
M
j n
n
M
W
w n e
e
1
2
d
d
h n
h
n w n
H
H
W
d
1
sin
/ 2
0
2
sin
/ 2 ,
sin
/ 2
1
sin
/ 2
0
2
M
M
M
W
M
M
Prof. M. Mansour
EECE 491: Discrete‐time Signal Processing
28
Effect of Window Function on Desired Frequency Response
(a) Convolution process implied by truncation of the ideal impulse response. (b) Typical
approximation resulting from windowing the ideal impulse response.
Prof. M. Mansour
EECE 491: Discrete‐time Signal Processing
29
Impact of Window Length
Conflicting requirements:
–
Want M to be as short as possible to minimize computation time (reduce hardware complexity)
–
Want W(w) to approximate an impulse as much as possible. From plot below, as M increases, width
of main lobe decreases (becomes closer and closer to an impulse)
/2
0
sin
1 / 2
sin
/ 2
M
j n
j M
n
M
W
w n e
e
Main lobe: region
between first
zero‐crossings
4
/
1
M
M
As M increases, peak amplitudes of main lobe and
side lobes grow in a manner such that the area under
each lobe is a constant, while the width of each lobe
decreases with M.
Prof. M. Mansour
EECE 491: Discrete‐time Signal Processing
30
Impact of Window Length (cont’d)
As
“slides by” discontinuity of
as w varies, the integral of
will oscillate as each side lobe of
moves past the
discontinuity
Since the area under each lobe remains constant with increasing M, the
oscillations occur more rapidly, but do not decrease in amplitude as M increases.
From theory of Fourier series, this non‐uniform convergence (Gibbs
phenomenon) can be moderated by using a less abrupt truncation of the Fourier
series
–
i.e. use a “tapered” window that smoothly falls to zeros at each end
–
This way the height of the side lobes can be diminished
–
However, this comes at the expense of a wider main lobe and hence a wider transition
region at the discontinuity
W
Hd
d
W
H
W
Prof. M. Mansour
EECE 491: Discrete‐time Signal Processing
31
Impact of Window Length (cont’d)
(Response normalized by M)
Prof. M. Mansour
EECE 491: Discrete‐time Signal Processing
32
Properties of Commonly Used Windows
All windows are symmetric
Prof. M. Mansour
EECE 491: Discrete‐time Signal Processing
33
Properties of Commonly Used Windows
Prof. M. Mansour
EECE 491: Discrete‐time Signal Processing
34
Properties of Commonly Used Windows
Fourier transforms (log magnitude) of windows with M = 50. (a) Rectangular. (b) Bartlett.
Rectangular:
•
Narrowest main‐lobe
•
First side‐lobe: only 13dB below main peak
•
This results in considerable oscillations around
discontinuities of Hd(w)
Prof. M. Mansour
EECE 491: Discrete‐time Signal Processing
35
Properties of Commonly Used Windows
(c) Hann. (d) Hamming. (e) Blackman.
Prof. M. Mansour
EECE 491: Discrete‐time Signal Processing
36
Comparison of Commonly Used Windows
largest
narrowest
largest
Prof. M. Mansour
EECE 491: Discrete‐time Signal Processing
37
Incorporation of Linear Phase
All windows have symmetry about the point M/2:
Hence Fourier transform:
–
We(w) is a real, even function of w.
If desired impulse response is also symmetric about M/2: hd(n)= hd(M – n)
–
Then windowed impulse response is also symmetric
–
Hence resulting frequency response is
If desired impulse response is anti‐symmetric about M/2: hd(n) = – hd(M – n)
–
Then windowed impulse response is also anti‐symmetric
–
Hence resulting frequency response is
j M /2
e
W
W
e
/2
j
M
e
H
A
e
(Ae(w) is a real, even function of w)
/2
j
M
o
H
jA
e
(Ar(w) is a real, odd function of w)
Prof. M. Mansour
EECE 491: Discrete‐time Signal Processing
38
Incorporation of Linear Phase
Assume desired hd(n) = hd(M – n)
Window is symmetric:
Then
j M /2
e
W
W
e
/2
j
M
d
e
H
H
e
(He(w) is a real, even function of w)
/2
/2
1
2
1
2
d
j
M
j
M
e
e
H
H
W
d
H
e
W
e
d
/2
j
M
e
H
A
e
1
2
e
e
e
A
H
W
d
(Ae(w) is a real, even function of w)
Equals periodic convolution of He(w) and We(w)
Prof. M. Mansour
EECE 491: Discrete‐time Signal Processing
39
Example 5
Assume desired response is
Corresponding impulse response:
Note that hd(n) = hd(M – n)
Using a symmetric window to truncate, results in linear phase:
/2
0
j M
c
d
c
e
H
/2
sin
/ 2
1
,
2
/ 2
c
c
j M
j n
d
c
n
M
h
n
e
e
d
n
n
M
sin
/ 2
/ 2
c n
M
h n
w n
n
M
Prof. M. Mansour
EECE 491: Discrete‐time Signal Processing
40
Example 5 (cont’d)
Illustration of type of approximation obtained at a discontinuity of the ideal frequency response.
/2
j
M
e
H
A
e
1
2
e
e
e
A
H
W
d
Any window:
•
Rectangular
•
Hann
•
Hamming
•
Blackman
Prof. M. Mansour
EECE 491: Discrete‐time Signal Processing
41
Example 5 (cont’d)
Peak P occurs when We(w – θ) is
shifted such that first negative side
lobe on right is just to the right of
wc.
P
V
Prof. M. Mansour
EECE 491: Discrete‐time Signal Processing
42
Example 5 (cont’d)
Valley V occurs when We(w – θ) is
shifted such that first negative
side lobe on left is just to the
right of wc.
•
Therefore, distance between peak ripples P & V on either side of discontinuity equals width of main lobe
•
Also due to symmetry of We(w – θ), overshoot δ in passband equals undershoot δ in stopband
P
V
Prof. M. Mansour
EECE 491: Discrete‐time Signal Processing
43
Example 5 (cont’d)
•
From 1 and 2: Windows with smaller side lobes yield better approximations of ideal response at
discontinuity
•
From 3: narrower transition regions can be achieved by increasing M.
•
Therefore, thru the choice of shape and duration of window, can control properties of resulting FIR filter
•
Rather than using a trial and error approach, Kaiser developed an formalization of the window approach
1
2
3
Prof. M. Mansour
EECE 491: Discrete‐time Signal Processing
44
Kaiser Window Filter Design Method
Trade‐off between main‐lobe width and side‐lobe area can be quantified by seeking a
window function that is maximally centered around w=0 in the frequency domain
Solution due to Kaiser:
Has two parameters:
–
Length parameter M.
–
Shape parameter β.
When β=0, reduces to rectangular
w n
I0 1
n
/
2
I0
n 0,1,2,,M
0
otherwise
2
M
0
: 0th-order modified Bessel function
of first kind
I
Kaiser windows for β = 0, 3, and 6 and M = 20.
Prof. M. Mansour
EECE 491: Discrete‐time Signal Processing
45
Kaiser Window Filter Design Method
(b) Fourier transforms of Kaiser windows in previous slide. (c) Fourier transforms of Kaiser windows with β =
6 and M = 10, 20, and 40.
As window is tapered more:
•
Side‐lobes become smaller
•
Main‐lobe becomes wider
Holding β constant while increasing
M causes main‐lobe to decrease in width
but does not affect peak amplitude of side‐
lobes
Prof. M. Mansour
EECE 491: Discrete‐time Signal Processing
46
Kaiser Window Filter Design Method
Kaiser derived a pair of formulas to predict in advance the values of M and β needed to
meet certain filter specs
Peak approximation error δ is determined by choice of β
For a given fixed δ:
–
Passband cutoff frequency wp of LPF defined to be highest frequency such that |H(w)| ≥ 1 – δ
–
Stopband cutoff frequency ws of LPF defined to be lowest frequency such that |H(w)| ≤ δ
–
Width of transition region: Δw = ws ‐ wp.
Define
The value of β needed to achieve a specified value of A is given by (determined empirically):
To achieve prescribed values of A and Δw, M must satisfy
20log10
A
0.4
0.1102
8.7
50
0.5842
21
0.07886
21
21
50
0.0
21
A
A
A
A
A
A
8
2.285
A
M
(Predicts M to within ±2 dB over a wide range of values of A and Δw)
Prof. M. Mansour
EECE 491: Discrete‐time Signal Processing
47
Comparison with other Windows
Comparison of fixed windows with Kaiser windows in a lowpass filter design application (M = 32 and
ωc = π/2). (Note that the designation “Kaiser 6” means Kaiser window with β = 6, etc.)
Prof. M. Mansour
EECE 491: Discrete‐time Signal Processing
48
Example 6: LPF Design using Kaiser Windows
Design a LPF using Kaiser window method having the following specs:
Since filters designed by window method have δ1= δ2, we set δ=0.001
Cutoff frequency: due to symmetry, we set wc to middle point
To get parameters of Kaiser window, first compute A and Δw:
Get β and M:
Get impulse response:
1
2
0.4 ,
0.6 ,
0.01,
0.001
p
s
0.5
2
p
s
c
20log10
60
A
0.2
s
p
0.4
0.5842
21
0.07886
21
5.653
A
A
8
2.285
37
A
M
h n
sin c n
n
I0 1
n
/
2
I0
n 0,1,2,,M
0
otherwise
18.5
2
M
M odd: Type II FIR
Prof. M. Mansour
EECE 491: Discrete‐time Signal Processing
49
Example 6 (cont’d)
Response functions for the lowpass filter
designed with a Kaiser window. (a)
Impulse response (M = 37). (b) Log
magnitude. (c) Approximation error for Ae
(ejω).
H(w)=0
1
0
appro. error
0
e
p
e
s
A
A
0.00113
0.001
Need to increase
M to 40 to meet
specs
Prof. M. Mansour
EECE 491: Discrete‐time Signal Processing
50
Design of Optimum Equiripple Linear‐Phase FIR Filters
Prof. M. Mansour
EECE 491: Discrete‐time Signal Processing
51
Optimum Approximations of FIR Filters
hd(n) and Hd(w): desired ideal impulse and frequency responses
h(n) and H(w): impulse and frequency responses of an FIR approximation
–
Assume h(n) = 0 for n < 0 and n > M.
How do we choose the M+1 samples of h(n) so as to minimize the mean‐square error (MSE)?
Solution: Using Parseval’s relation
Since we only have control over e(n) for 0 ≤ n ≤ M, then ε2 is minimized if we choose h(n) =
hd(n) for 0 ≤ n ≤ M
This is equivalent to choosing a rectangular window: h(n) = hd(n) × w(n)
–
That is, a rectangular window provides the best mean‐square error (MSE) approximation to a desired
frequency response for a given value of M.
Disadvantages of the MSE approximation criterion
–
Adverse behavior at discontinuities (error greatest at either side of discontinuity)
–
Does not permit individual control over approximation error in different bands
Alternative: Use a “minimax” or frequency‐weighted criterion strategy
–
Minimize maximum errors
–
Achieved using algorithmic techniques
2
2
1
2
Hd
H
d
2
2
n
e n
0
0
d
d
d
h
n
n
e n
h
n
h n
n
M
h
n
n
M
Prof. M. Mansour
EECE 491: Discrete‐time Signal Processing
52
Optimum Approximations of FIR Filters
For frequency selective filters designed by windowing technique:
–
Error is greatest on either side of a discontinuity of the ideal frequency response
–
Error gradually becomes smaller for frequencies away from the discontinuity
–
Such filters result in approximately equal errors in passband and stopband
Idea: Spread out approximation error uniformly in frequency and adjust passband and
stopband ripples separately so as to meet certain given deign specs
–
Better than just meeting spec at one frequency and far exceeding it at others
Start by considering Type‐I FIR filter (even length) with zero‐phase, i.e. say
–
he(n) = he(‐n)
–
Then insert a delay sufficient to make it causal
To get causal system:
Ae z
he n zn
nL
L
he 0
he n zn zn
n1
L
Ae he 0
he n e jn e jn
n1
L
he 0
2he n cosn
n1
L
/ 2
e
h n
h
n
M
h M
n
L M
2
j M /2
e
H
A
e
Prof. M. Mansour
EECE 491: Discrete‐time Signal Processing
53
Optimum Approximations of FIR Filters
Tolerance scheme and ideal response for lowpass filter
–
Unity is to be approximated in the passband with maximum absolute error δ1.
–
Zero is to be approximated in the stopband with maximum absolute error δ2.
Algorithmic technique: Vary the (L+1) values of he(n) to meet these specs
Choices: Some of the parameters are fixed and an iterative procedure is
used to obtain optimum adjustments of the remaining parameters
Most famous approach: Parks‐McClellan algorithm
–
Fix
–
Vary
1
0
2
cos
L
e
e
e
n
A
h
h
n
n
0
p
s
1
2
,
,
,
s ,
p
L
1
2
,
,
,
/
s
L p
1
or 2
Prof. M. Mansour
EECE 491: Discrete‐time Signal Processing
54
Parks‐McClellan Algorithm
Formulate filter design problem as a problem in polynomial approximation
The terms cos(wn) can be expressed as a sum of powers of cos(w)
Fix and let vary
Problem becomes a Chebyshev approximation over disjoint sets
Approximation error function
–
E(w), weighting function W(w), and Hd(w) are defined on closed sub‐intervals:
–
Ex: and for LPF
–
The approximating function Ae(w) is not constrained and can take any shape in the transition band to
meet the specs
1
0
2
cos
L
e
e
e
n
A
h
h
n
n
cos
n cos
n
T
n
Tn : th order Chebyshev polynomial
n
0
cos
L
k
e
k
k
A
a
cos
e
x
A
P x
0
L
k
k
k
P x
a x
P : th order approximation polynomial
L
,
s ,
L p
1
, 2
d
e
E
W
H
A
0
p
s
Prof. M. Mansour
EECE 491: Discrete‐time Signal Processing
55
Example
Obtain an approximation as the following where L, wp, ws are fixed design parameters
1
0
0
p
d
s
H
Weighting function:
2
/ 1
0
1
p
s
W
If Ae(w) is as follows
Get this approximation error
Prof. M. Mansour
EECE 491: Discrete‐time Signal Processing
56
Minimax or Chebyshev Criterion
Minimax criterion:
–
Seek response Ae(w) that minimizes the maximum weighted approximation error within frequency
intervals of interest
–
Equivalently, we seek impulse response he(n) that minimizes δ in the figure below
Parks‐McClellan applied the “alternation theorem” from approximation theory to this filter
design problem
:0
max
min
h
n
n
F
e
E
d
e
E
W
H
A
F closed subset of 0
0 p
∪ s
Prof. M. Mansour
EECE 491: Discrete‐time Signal Processing
57
Alternation Theorem
Let Fp be a closed set consisting of the disjoint union of closed subsets of the real axis x.
Define the rth‐order polynomial P(x) to be:
Let DP(x) be a given desired function of x that is continuous on Fp.
Let WP(x) be a positive weighting function that is continuous on Fp.
Let Ep be the weighted error between the desired function DP(x) and the polynomial P(x):
The maximum error is defined as
A necessary and sufficient condition on P(x) to be the unique rth‐order polynomial that
minimizes is that EP(x) exhibits at least (r+2) alternations
–
That is, there must exit at least (r+2) values xi in Fpsuch that
The points x at which the polynomial attains the maximum approximation error are
called extremal points
0
r
k
k
k
P x
a x
P
P
P
E
x
W
x
D
x
P x
E
xFP
max EP x
x1 x2 xr2
and such that
EP xi
EP xi
E , i 1,2,,r 1
E
E
Prof. M. Mansour
EECE 491: Discrete‐time Signal Processing
58
Example: Applying Alternation Theorem to Polynomials
Examine polynomials that approximate unity in ‐1 ≤ x ≤ ‐0.1 and approximate zero for 0.1 ≤
x ≤ 1.
Consider three 5th order polynomials. Determine which, if any, satisfy the alternation
theorem.
From theorem, P(x) must have 5+2=7 alternations
Only 5 alternations
Alternations occur at extermal points, but not all extremal
points are alternations
Not alternations
Only 5 alternations
Not alternations
−
+
−
+
−
Has 8 alternations
Prof. M. Mansour
EECE 491: Discrete‐time Signal Processing
59
Optimal Type I Lowpass Filters
For type 1 filters, the polynomial P(x) is the cosine polynomial Ae(w) (x=cos(w), r=L)
Let DP(x) is the desired lowpass frequency response with x=cos(w):
WP(x), the positive weighting function in terms of x=cos(w) is:
Weighted approximation error is
For LPF, the closed subset FP is the union
Alternation theorem states:
–
Set of coefficients ak in P(cos(w)) above will correspond to LPF representing the unique best
approximation to the ideal LPF with the ratio 1/2 fixed at K, and with passband and stopband edges
p, s iff EP(cos) exhibits at least (L+2) alternations in FP.
0
cos
L
k
e
k
k
A
a
0
cos
cos
L
k
k
k
P
a
1
0
0
p
d
s
H
1
cos
cos
1
cos
0
1
cos
cos
p
P
s
D
1
2
1/
cos
cos
1
cos
,
/
1
1
cos
cos
p
P
s
K
W
K
cos
cos
cos
cos
P
P
P
E
W
D
P
FP cos p cos 1
∪ 1 cos coss
Prof. M. Mansour
EECE 491: Discrete‐time Signal Processing
60
Example
Typical example of a lowpass filter approximation that is optimal according to the
alternation theorem for L = 7.
To test optimality, redraw as a function of cos