
EECE 340 Chapter 4, Fall 2011
American University of Beirut · Signals and Systems · 39 pages · Prof. Karim Kabalan

Showing the first 10 of 39 pages. Download the PDF to see all of it.
More EECE 340 files
Show the text of this chapter
Chapter 4
The Laplace Transform
The Laplace Transform
1.
In this lesson, we'll introduce the Laplace Transform. The
Laplace Transform is useful in a number of different
applications. Using the Laplace Transform, differential
equations can be solved algebraically.
2.
We can use pole/zero diagrams from the Laplace Transform
to determine the frequency response of a system and whether
or not the system is stable.
3.
We can transform more signals than we can with the Fourier
Transform, because the Fourier Transform is a special case of
the Laplace Transform.
4.
The Laplace Transform is used for analog circuit design.
5.
The Laplace Transform is used in Control Theory and
Robotics
Definitions of Laplace Transform
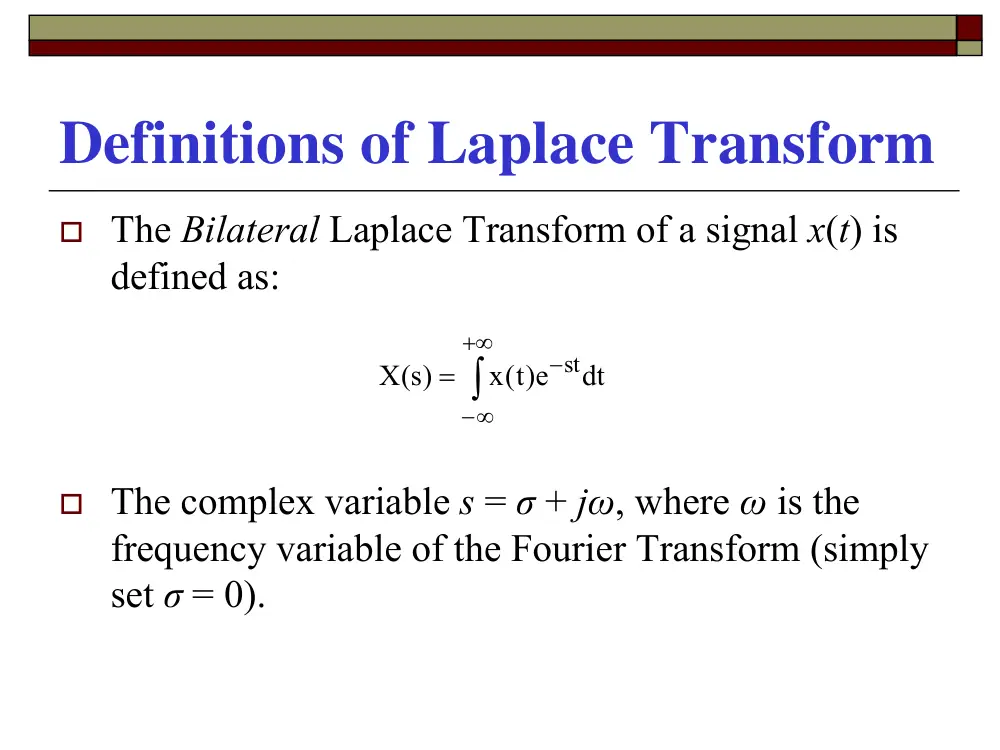
� The Bilateral Laplace Transform of a signal x(t) is
defined as:
� The complex variable s = σ + jω, where ω is the
frequency variable of the Fourier Transform (simply
set σ = 0).
∫
+∞
∞
−
−
=
dt
e)t(
x
)s(
X
st
The Inverse Bilateral Laplace Transform
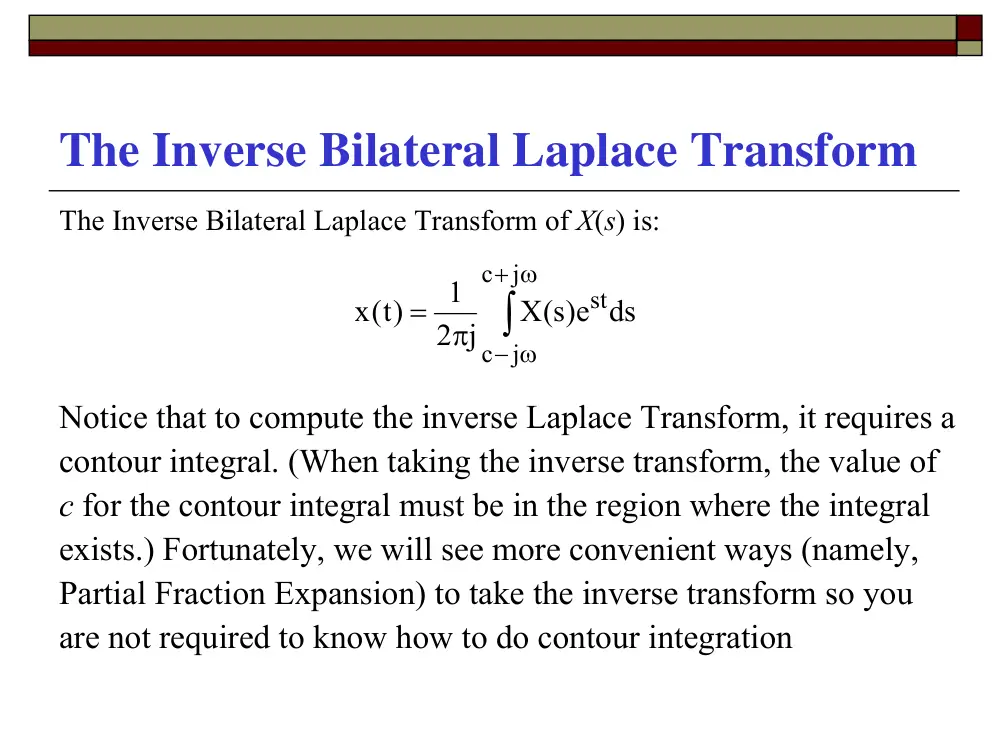
The Inverse Bilateral Laplace Transform of X(s) is:
Notice that to compute the inverse Laplace Transform, it requires a
contour integral. (When taking the inverse transform, the value of
c for the contour integral must be in the region where the integral
exists.) Fortunately, we will see more convenient ways (namely,
Partial Fraction Expansion) to take the inverse transform so you
are not required to know how to do contour integration
∫
ω
+
− ω
π
=
j
c
j
c
stds
e)s(
X
2 j
1
x )t(
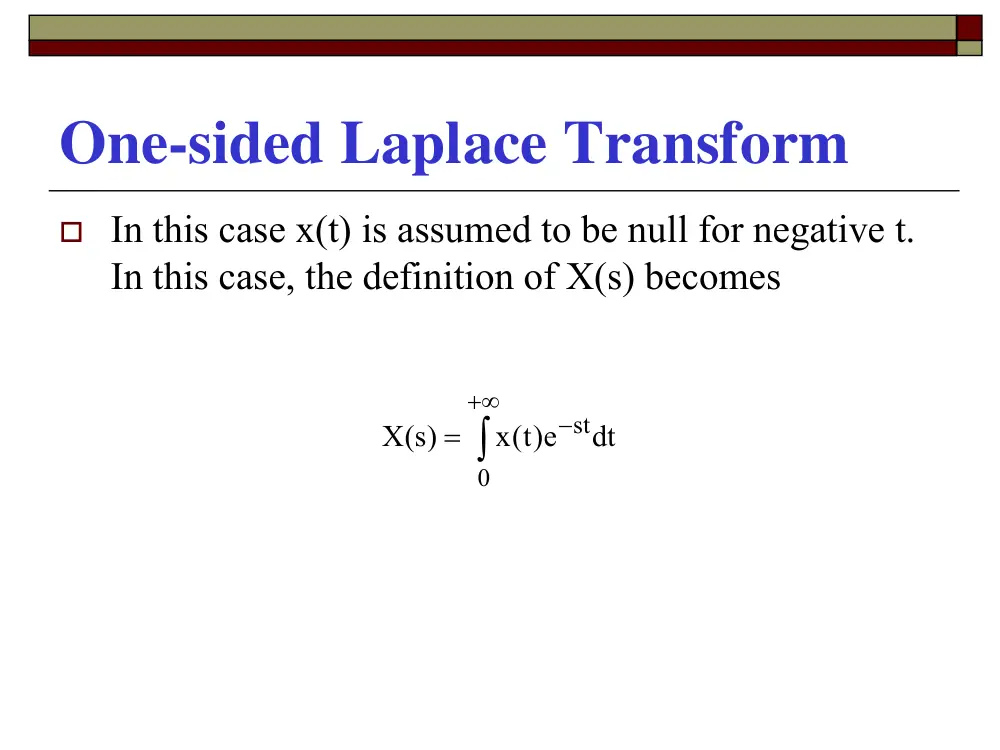
One-sided Laplace Transform
� In this case x(t) is assumed to be null for negative t.
In this case, the definition of X(s) becomes
∫
+∞
−
=
0
stdt
e)t(
x
X )s(
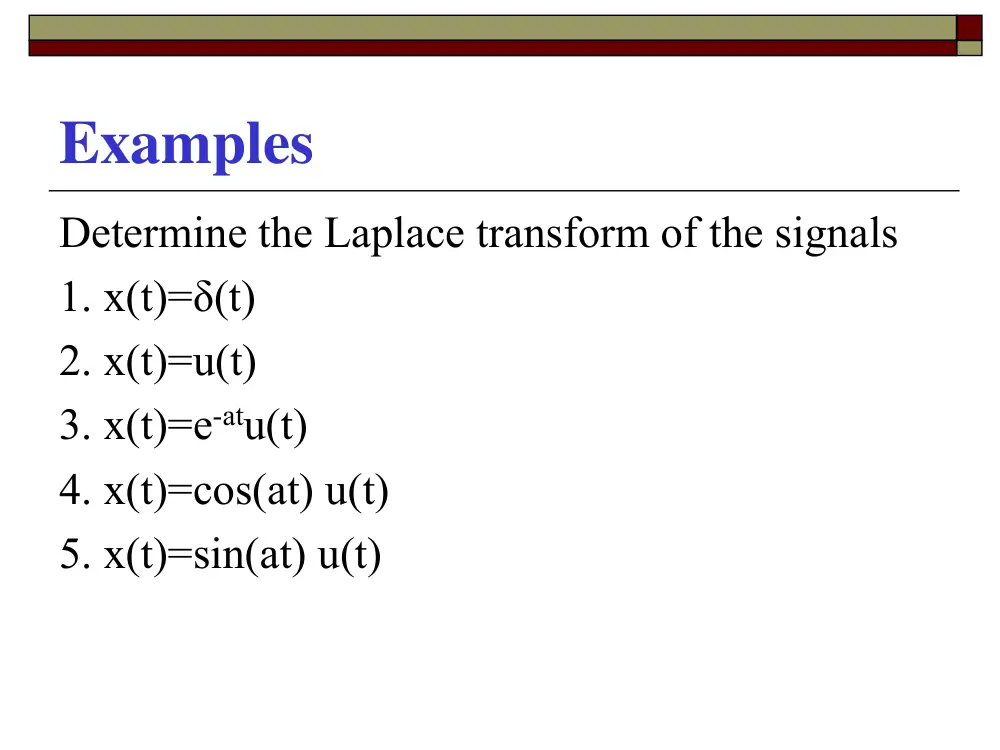
Examples
Determine the Laplace transform of the signals
1. x(t)=δ(t)
2. x(t)=u(t)
3. x(t)=e-atu(t)
4. x(t)=cos(at) u(t)
5. x(t)=sin(at) u(t)
Properties of the LT
� Linearity
� Time shifting
� Differentiation
� Integral
� Multiplication by t
� Convolution
� Initial Value Theorem
� Final Value Theorem
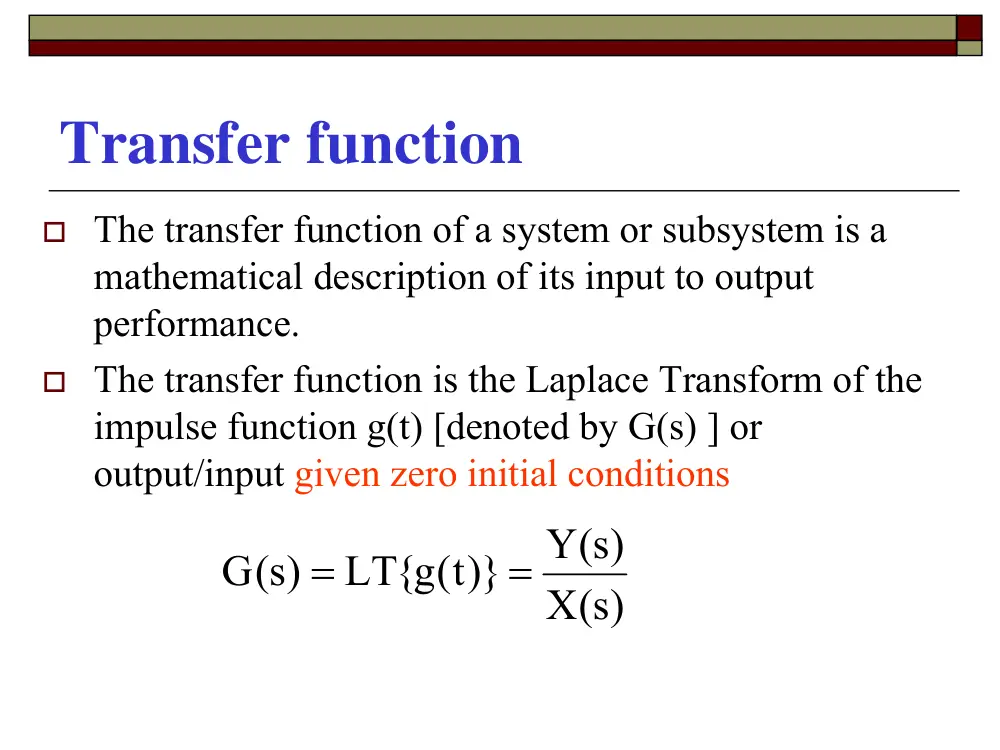
Transfer function
� The transfer function of a system or subsystem is a
mathematical description of its input to output
performance.
� The transfer function is the Laplace Transform of the
impulse function g(t) [denoted by G(s) ] or
output/input given zero initial conditions
X )s(
Y )s(
LT{g t( )}
G )s(
=
=
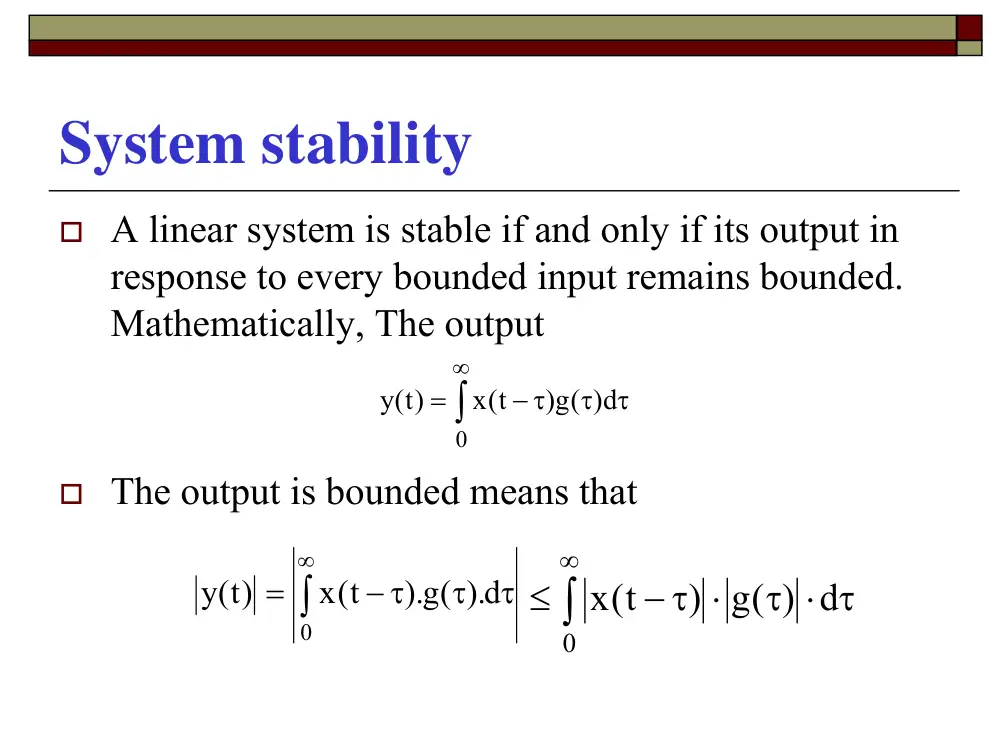
System stability
� A linear system is stable if and only if its output in
response to every bounded input remains bounded.
Mathematically, The output
� The output is bounded means that
∫
∞
τ
τ
− τ
=
0
)g( )d
x t(
)t(
y
∫
∞
τ
τ
− τ
=
0
).g( ).d
x t(
y )t(
∫
∞
τ ⋅ τ
− τ ⋅
≤
0
) g( ) d
x t(
System stability
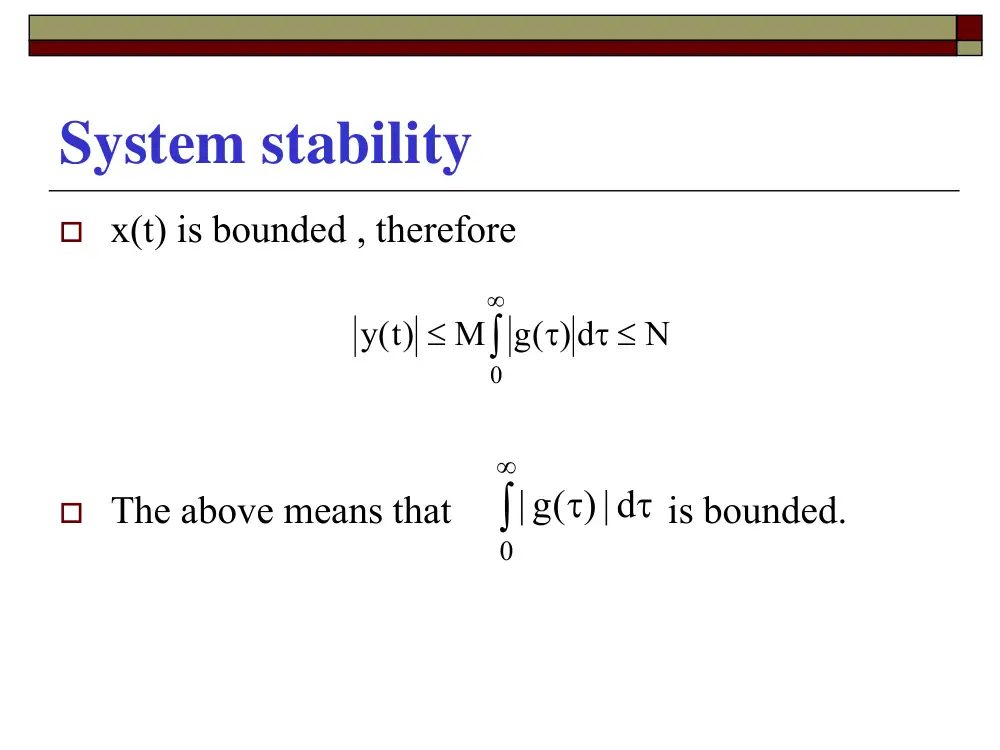
� x(t) is bounded , therefore
� The above means that
is bounded.
∫
∞
τ ≤
τ
≤
0
N
g( ) d
M
)t(
y
∫
∞
τ
τ
0
|) d
| g(
System stability in the s-domain
�
A linear system is stable if and only if all poles of the
transfer function lie in the left-half of the complex-plane.
�
The above means that Q(s) has no roots in the RHP and on
the jω axis
Q )s(
P )s(
X )s(
Y )s(
=
System stability in the s-domain
In order to determine the system stability in the
s-domain, 2 steps are needed
� Determine the closed loop transfer function
� Check for the location of the poles of
Y(s)/X(s) or Zeros of Q(s)
Transfer Function computation
� In this section, we will try to determine the
transfer function of a LTI system represented
by either a DE or by block diagram.
Example 1
� An LTI system, whose output is c(t) and input
r(t), is represented by the following DE.
Determine the Transfer function of this
system
)t(r
2
2c )t(
)t(c
3
c )t(
=
+
+ �
��
Example 2
Determine the transfer function of the following system
Example 3
Determine the transfer function of the following system
C(s)
The transfer function of the above system is:
G )s( H )s(
1
G )s(
)s(
R
C )s(
= +
Example 3. Important Notation
�
G(s) the forward transfer function.
�
H(s) the feedback transfer function.
�
In many cases, H(s) = 1, and the system is called a
unity feedback system.
�
In this case, E(s) is called the error signal.
�
G(s)/[1+G(s)H(s)] is called the closed-loop transfer
function.
�
{G(s)H(s)} is the open-loop transfer function.
Example 4
Determine the transfer function of the following system
Example 5
General Gain Formula for Signal
Flow Graphs (Mason’s rule)
For an LTI system, the TF is computed as follows
Where M is the gain between yin and yout , yout is
the output node variable, yin is the input node
Variable, N is the total number of forward paths,
and Mk is the gain of the Kth forward path.
∑
=
∆
∆
=
=
N
1
k
k
k
in
out
M
y
y
M
General Gain Formula for Signal
Flow Graphs (Mason’s rule)
∆ =1 – (sum of all individual loop gains) + (sum
of gain products of all possible combinations
of 2 non-touching loops) - (sum of gain
products of all possible combinations of 3
non-touching loops) + …..
∆k = the ∆ for that part of the signal flow graph
which is non-touching with the Kth forward
path.
Example 5
2
4
4
1
2
3
2
3
2
1
1
2
1
4
1
3
1 2
G H
G G
G G H
G G G
1 G G H
G G
G G G
R
C
+
+
+
+
+
+
=
Check for the location of the poles of Y(s)/X(s)
A transfer function of the form
An analytical procedure for determining the exact location of
the poles of the TF (n>3) function is impossible. As we need
to know the stability of the system, determining the number
of roots in each half of the complex plane is sufficient.
0
1
n 1
n 1
n
n
0
1
m 1
m 1
m m
b
b s
....
s
b
b s
a
a s
....
s
a
a s
X )s(
Y )s(
+
+
+
+
+
+
+
+
=
−
−
−
−
Routh and Hurwitz criteria (RH)
�
This theory gives an affirmative answer for the absolute
stability, but it does not give any information about the relative
stability of the system.
�
It is based on the coefficients of the polynomial Q(s).
�
Necessary conditions but not sufficient
1. all b’s have the same sign.
2. None is zero.
0
..............
0
1
1
1
=
+
+
+
+
−
−
b
b s
s
b
b s
n
n
n
n
The RH Table
n
s
nb
nb −2
−4
nb
nb −1
nb −3
nb −5
−1
ns
−2
ns
−3
ns
1c
2c
3c
d3
d1
2
d
1
g
1h
1s
0s
RH Table Coefficients
The R-H criterion states that the number of polynomial roots with
positive real part equals the number of coefficient sign changes in
the first column of the coefficient array we have developed
1
3
2
1
1
−
−
−
−
−
=
n
n
n
n
n
b
b b
b
b
c
1
5
4
1
2
−
−
−
−
−
=
n
n
n
n
n
b
b b
b
b
c
1
1 2
3
1
1
c
c
b
c b
d
n
n
−
− −
=
Where
The R-H criterion states that the number of polynomial roots
with positive real part equals the number of coefficient sign
changes in the first column of the coefficient array we have
developed.
1
3
2
1
1
−
−
−
−
−
=
n
n
n
n
n
b
b b
b
b
c
1
5
4
1
2
−
−
−
−
−
=
n
n
n
n
n
b
b b
b
b
c
1
1 2
3
1
1
c
c
b
c b
d
n
n
−
− −
=
Example:
1 pole in RHP, system is unstable .
2
1
2)
1)(
(
1
( )
2
−
+
=
+
−
=
s
s
s
s
s
Q
2
0
1
2
1
0
1
2
−
−
s
s
s
Example:
(Two sign changes ; 2 poles in RHP), System is unstable.
800
200s
88s
14s
2s
s
20
17s
12s
3s
)s(
Q
2
3
4
5
2
3
+
+
+
+
+
−
+
−
=
1 14 200
2 88 800
-30 -200 0
74.7 800
121 0
800
5s
4
s
3s
s2
1s
0s
Example:
Two RHP roots.
1
0
3
6
2
3
1
3
6
0
3 2
( )
0
1
6
2
2
3
1
0
2
1
2
3
4
5
s
s
s
nb
s
s
s
−
−
−
δ
δ
δ
δ
δ
is very small number
δ
1
2s
6s
3s
2s
s
)s(
Q
2
3
4
5
+
+
+
+
+
=
Example :
Auxiliary Polynomial
A(s)=
8
12s
6s
3s
s
)s(
Q
2
3
4
+
+
+
+
=
8
0
4
0
0
0
8
2
0
12
3
8
6
1
0
1
1
2
3
4
s
s
s
s
s
s
8
2
2 +
s
s
ds
dA s
4
( )
=
roots of A(s) are roots of Q(s).S ystem is unstable
2j
s;4
,8 then s
2s
)s(
A
2
2
= ±
= −
⋅
+
=
Example
8
20s
16s
4s
2s
5s
4s
s
)s(
Q
2
3
4
5
6
7
+
+
+
+
+
+
+
=
State-Variable Representation of LTI Systems
�
The state variable and the state equation of a dynamic system
are defined simply as a set of first-order differential equations
relating the state variables among themselves and to the inputs
�
This representation is best done with the use of an example
BU )t(
AX )t(
dt
dX )t(
+
=
Example
A linear system has one input and one output. The
input-output relation is defined by:
where y(t) is the output signal and r(t) is the input
signal. Write the state equations of this system
)t(r
3
dt
2 dr )t(
6y )t(
dt
5dy )t(
dt
3d y )t(
dt
d y )t(
2
2
3
3
+
=
+
+
+
Steps
1.
Put the highest derivative on one side and the
rest on the other sides. Remember that for
stability the derivative order of the output is
greater than or equal to that of the input.
2.
Apply number of integrators equal to that of
the order of the derivative of y(t).
3.
Construct the block diagram
4.
Deduce the state equations.
Solution
Step 1
)t(r
3
dt
2 dr )t(
6y )t(
dt
5dy )t(
dt
3d y )t(
dt
d y )t(
2
2
3
3
+
+
−
−
= −
step 2
step 3
∫∫∫
∫∫
∫∫∫
∫
∫∫
+
+
−
−
= −
dt
)t(r
3
dt
)t(r
2
y )t( dt
6
y )t( dt
5
3 y )t( dt
)t(
y
-3
-5
-6
3
2
y(t)
∫
∫
∫
Step 4
Let
be the outputs of the integrators.
From the figure, we obtain
Moreover, the output y(t) is given by:
)t(
t( ),X
t( ),X
X
3
2
1
)t(
X
)t(
3X
)t(
X
dt
)t(
dX
2
1
/
1
1
+
= −
=
)t(r
2
)t(
X
)t(
5X
)t(
X
dt
)t(
dX
3
1
/
2
2
+
+
= −
=
)t(r
3
6X t(
)t(
X
dt
)t(
dX
1
/
3
3
+
= −
=
)t(
X
)t(
y
1
=
The above equations can be written in a matrix form
)t(r
3
2
0
)t(
X
)t(
X
)t(
X
0
0
6
1
0
5
0
1
3
X )t(
)t(
X
)t(
X
)t(
X
3
2
1
/
3
/
2
/
1
⎥
⎥
⎥
⎦
⎤
⎢
⎢
⎢
⎣
⎡
+
⎥
⎥
⎥
⎦
⎤
⎢
⎢
⎢
⎣
⎡
⎥
⎥
⎥
⎦
⎤
⎢
⎢
⎢
⎣
⎡
−
−
−
=
=
⎥
⎥
⎥
⎦
⎤
⎢
⎢
⎢
⎣
⎡
[
]
[ ]
)t(r
0
)t(
X
)t(
X
)t(
X
0
0
1
)t(
y
3
2
1
+
⎥
⎥
⎥
⎦
⎤
⎢
⎢
⎢
⎣
⎡
=